
301 Moved Permanently
One important constraint of PV solar design is the allowable voltage drop for both DC and AC circuits. These limits, which are often given in percentage points for maximum and/or average allowable voltage drops, are usually dictated by the energy model used for the project or are based on best industry practices. They are among critical design specifications, as they represent a cap on lost energy in the category of resistive losses.
This article will focus on three areas related to string voltage drops in an array of modules:
1) Development of a visual tool for quickly checking on the maximum string voltage drop;
2) Introduction of a quick means of calculating the average voltage drop without the need for determining the voltage drop of each string in the array; and
3) Development of a method that determines the unique location for string inverters (or combiner boxes) that results in minimizing the average voltage drop of the strings of the array.
Although this article will focus on DC voltage drop in string wires that connect strings of modules to one or more string inverters, the same principles are directly applicable if the string inverters were to be replaced by string combiner boxes for projects that employ central inverters instead of string inverters.
Consider a string inverter and its associated strings of modules forming an array. Having chosen the conductor size for the strings, and given the rated current and voltage of each string, the designer can convert the design maximum and average voltage drops into quantities for maximum and average string lengths, respectively, using Ohm’s law. Given this equivalency between string lengths and voltage drops, this article focuses on determining the maximum and average string lengths as a substitute for maximum and average voltage drops.
1) Maximum string voltage drop
Let’s assume, for demonstration purposes, that the design is calling for a maximum of 0.75% string voltage drop and that this has resulted in a maximum allowable string length of 225 feet for a particular project.
Developing a visual tool can enable the designer to quickly check and see if placement of the inverter at a particular point within its array will not violate the maximum string length. Conversely, the same tool can be used to help the designer choose the array boundaries around the inverter in a way that this maximum string length is not violated.
Assume that we have placed a pair of rectangular coordinate axes on the solar field and oriented them in such a way that the X axis is parallel to the module rows and the Y axis is perpendicular to the module rows. Place the string inverter (or a cluster of several string inverters) at the intersection of the two axes. We will further assume that string wires are run in paths that are parallel and perpendicular to rows, as this is the common practice in running string conductors.
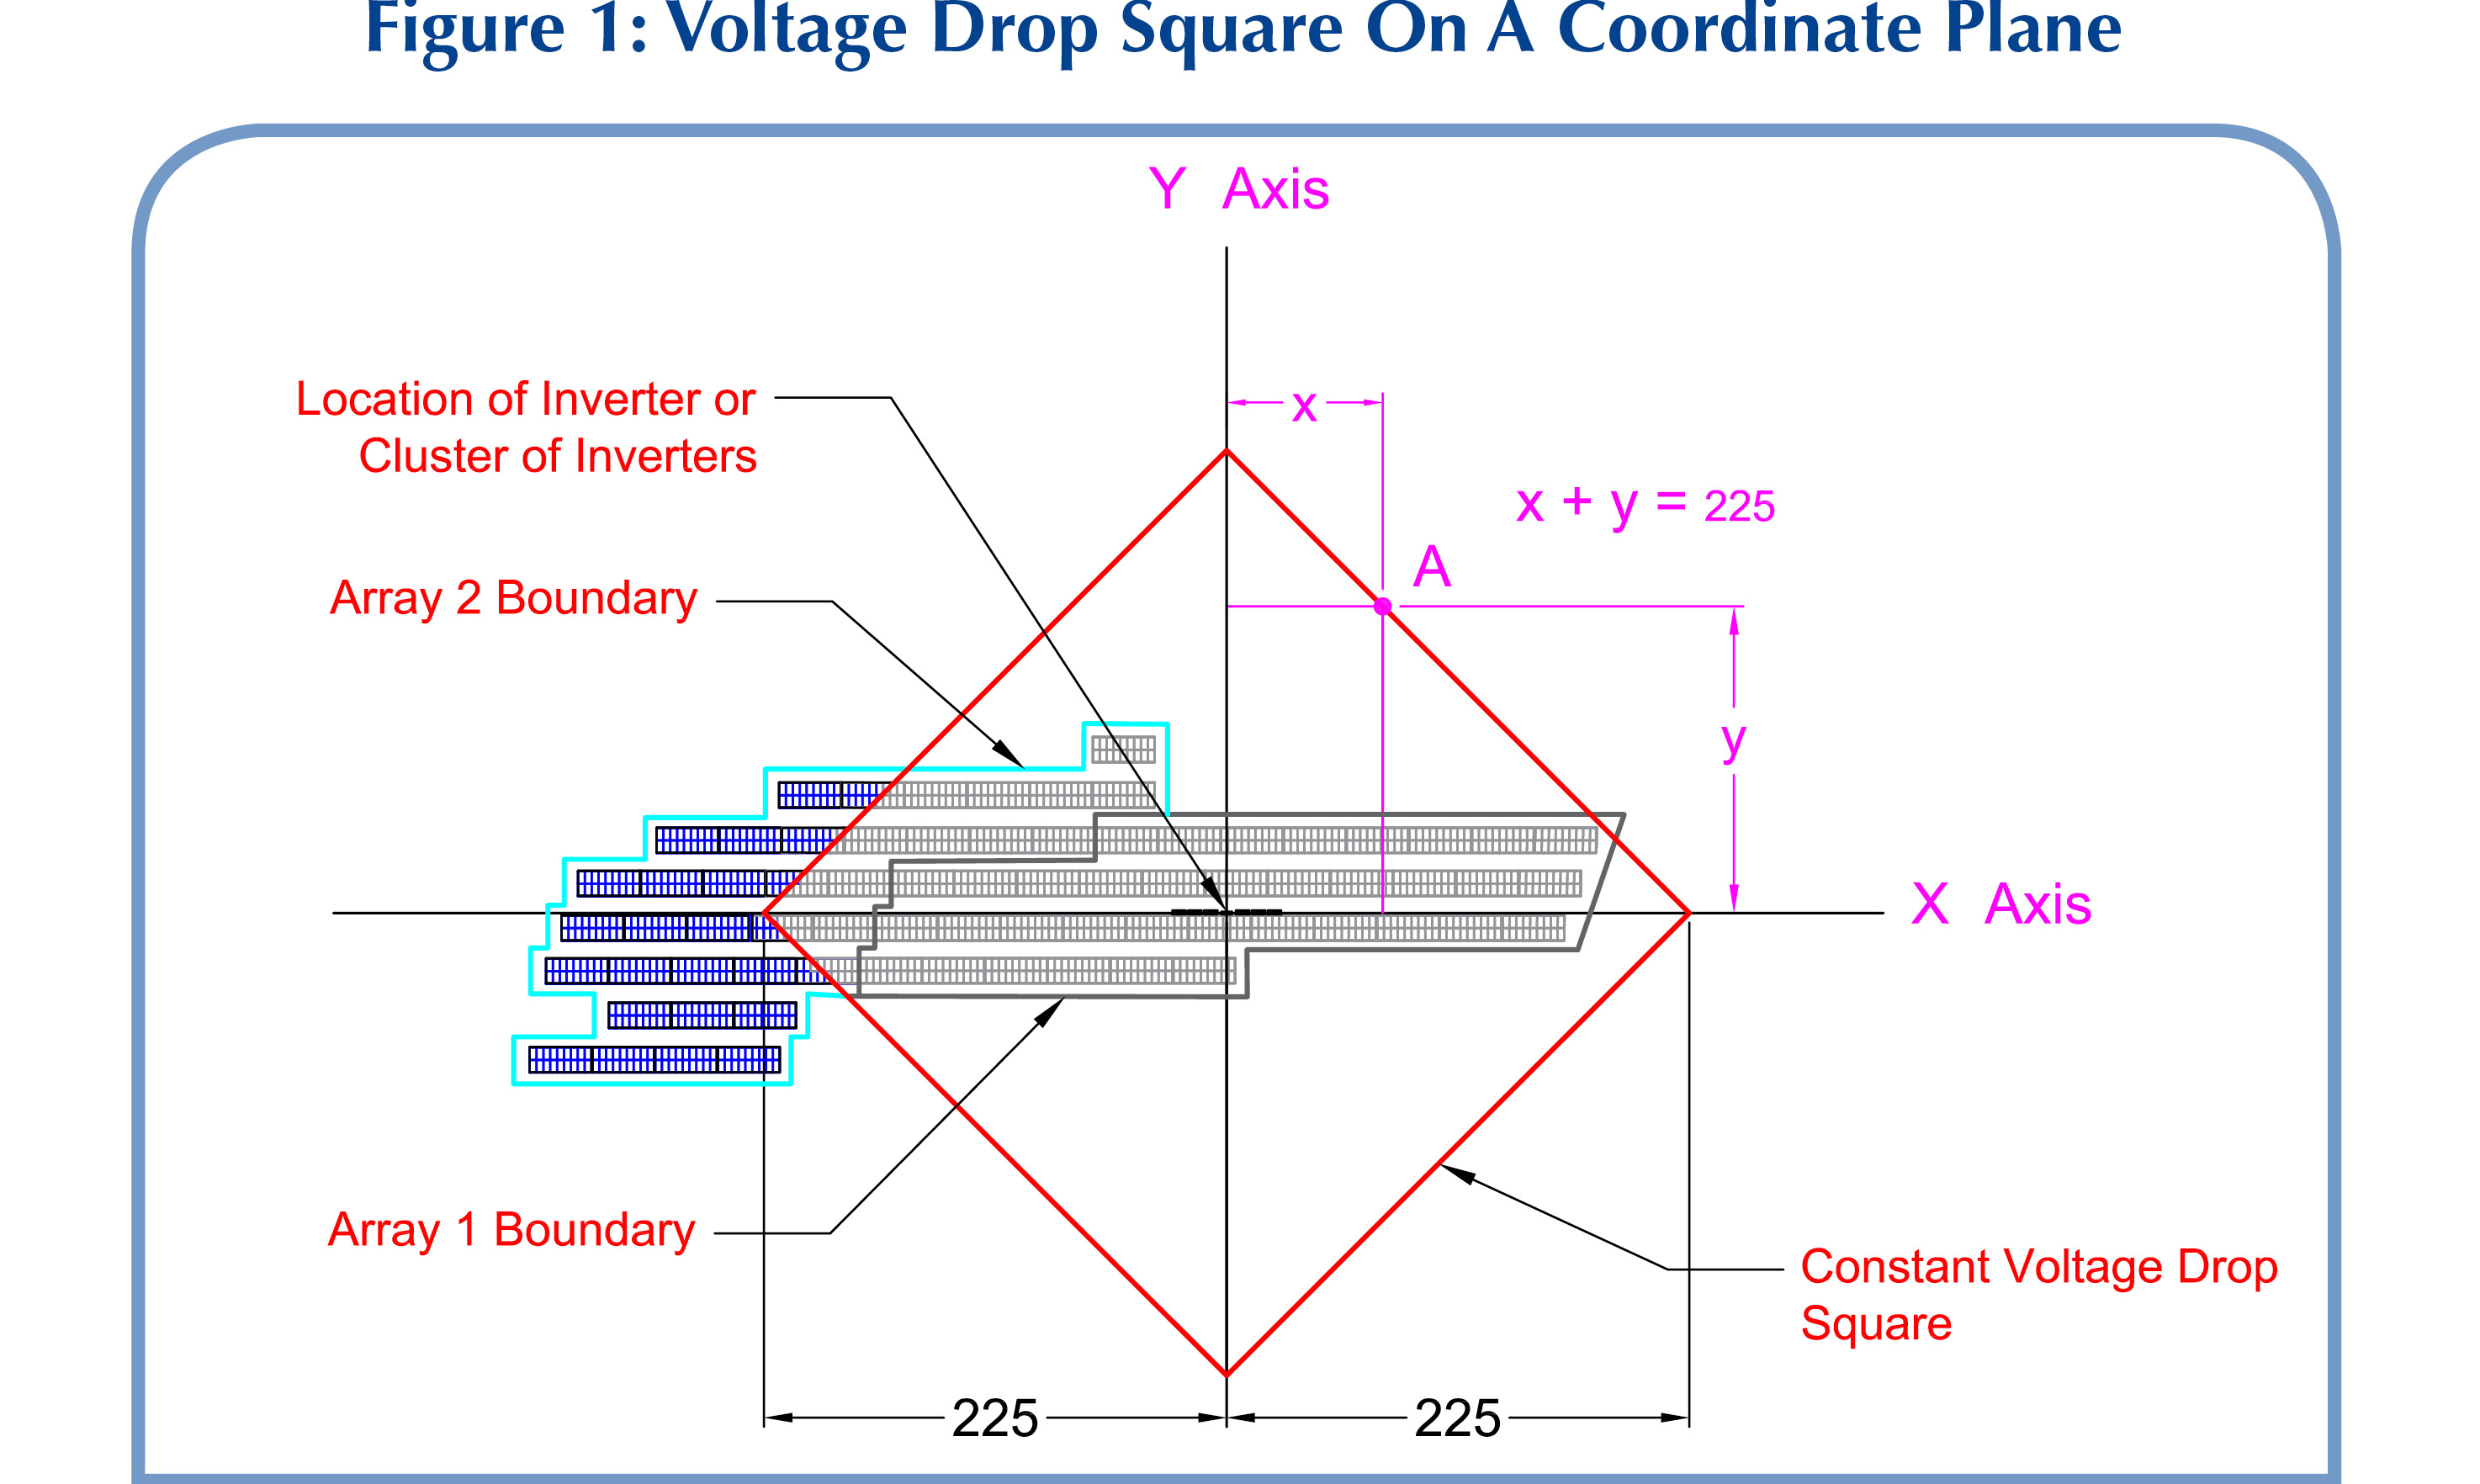
A string connecting any point in the field of the array to the inverter will have a length of x + y, where x is the distance of the point from the Y axis and y is the distance of the point from the X axis. For our example, this length needs to be less than or equal to 225 feet, or x + y ≤ 225. It is seen that all of those points that satisfy this 225-foot maximum distance from the origin lay on or inside a square with a diameter of 2 x 225 = 450 feet, with its center coinciding with the inverter(s) at the origin and its two diameters coinciding with the X and Y axes. Such a square, shown in Figure 1, can easily be built and accurately oriented in AutoCAD. Placing the center of this square on the inverter will enable the designer to immediately know if all of the strings in the array are in compliance with the maximum voltage drop requirement.
On the other hand, if the goal is to determine candidate locations for placement of the inverter(s), then the square can be moved around over the array in such a way so as to keep the entire array within it, and the center of the square will determine the allowable locations for placement of the inverter(s). For an existing array and the pre-selected inverter location, the maximum voltage drop square can be used to determine the maximum string length. Such a square can be built, centered at the inverter and oriented as previously. The smallest square of this type that contains the entire array will give the maximum voltage drop. All that is needed in this case is to measure half of the diameter of this square and convert it to a corresponding maximum string voltage drop present in the array using the string’s rated current and voltage.

Figure 1 shows the constant voltage drop square superimposed on two neighboring arrays for the case for which maximum string length is determined to be 225 feet, as in our example. The square is centered on a cluster of six string inverters and their associated panelboards.
As seen in the figure, all of the strings in array 1 are under 225 feet in length, while only some of the strings in array 2 are under this maximum length if connected to the inverters at the origin.
2) Average string voltage drop
There is also a method for calculating the average voltage drop for strings of an array of modules. Once again, because the average voltage drop can be translated to an average string length, I will focus on determining the average string length for the array. The process introduced does not rely on the measurement of individual string lengths and saves design time while obtaining reliable results.
Given a string inverter (or cluster of string inverters) and its associated array of modules, let’s superimpose a pair of rectangular coordinate axes on the solar field, oriented in such a way so that the X axis is parallel to the module rows and the Y axis is perpendicular to the module rows, and place the intersection point of the two axes on the inverters. The pair of axes will segment the array in four quarters. As before, I will assume that string conductors are run in paths that are parallel and perpendicular to rows. To calculate the average string length, we will assume that every point (x, y) within the boundaries of the array is connected to the inverters in the aforementioned manner. Let’s also assume that we have found the centroid of each of the four quadrants of the array and the area of each quadrant. We will call the distances of each of the centroids from the inverters L1, L2, L3 and L4 for centroids of quadrants 1 through 4, keeping in mind that these are sums of distances from X and Y axes for each centroid. Let’s call the areas of each quadrant of the array S1, S2, S3 and S4 for quadrants 1 through 4. It can be shown that the average length of all points of the array to the inverter is given by the average of L1, L2, L3 and L4 weighted by the areas S1, S2, S3 and S4, as in the following expression:
Average String Length = (L1 x S1 + L2 x S2 + L3 x S3 + L4 x S4) ÷ S
where S = S1 + S2 + S3 + S4 is the total area of the array.

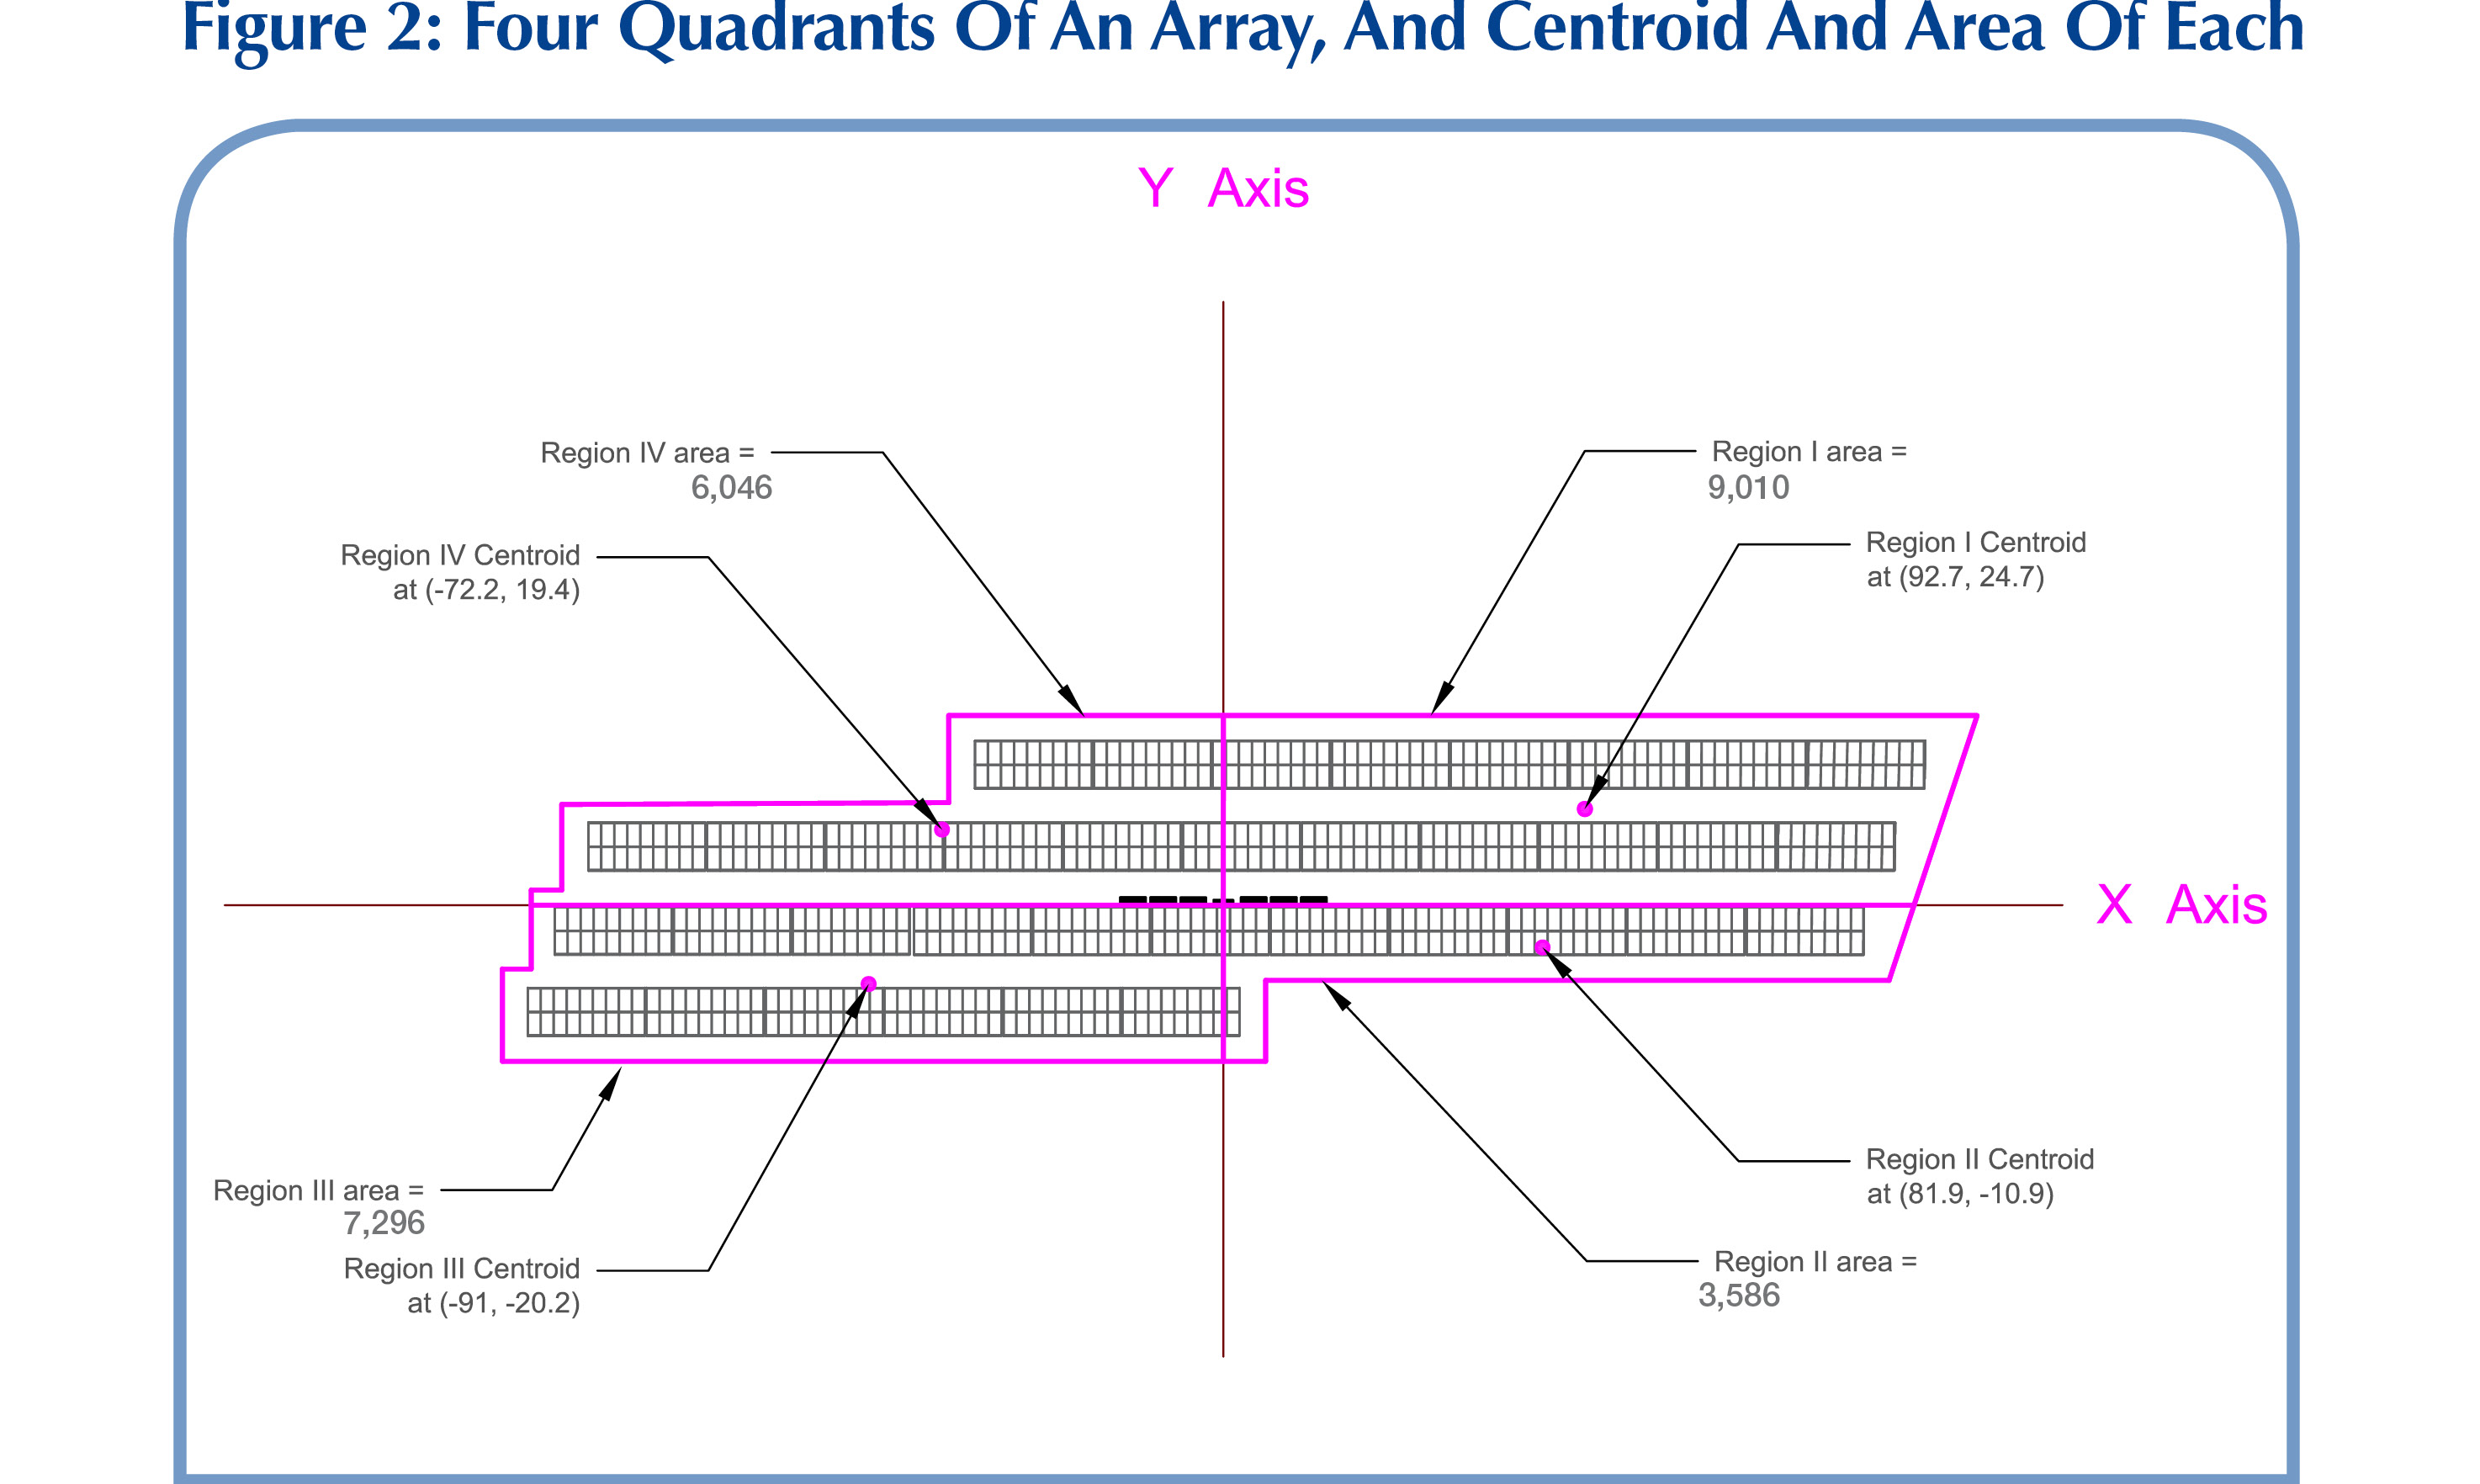
Figure 2 shows array 1 of the previous figure. To determine the centroids and areas, we first will draw and convert to a “region” each of the four quadrants of the array in AutoCAD. Next, using the “MASSPROP” command, we determine the coordinates of the centroid of each region and the area of each region in feet and square feet, respectively. These values are given in Figure 2.
From the information given in the figure, we have the following:
L1 = 92.7 + 24.7 = 117.4 feet
L2 = 81.9 + 10.9 = 92.8 feet
L3 = 91 + 20.2 = 111.2 feet
L4 = 72.2 + 19.4 = 91.6 feet
Average String Length of array = (117.4 x 9,010 + 92.8 x 3,586 + 111.2 x 7,296 + 91.6 x 6,046) ÷ 25,938 = 106.22 feet.
Assuming a voltage drop of 0.75% for 225 feet of string conductor, the average voltage drop for this array will be 0.35%.
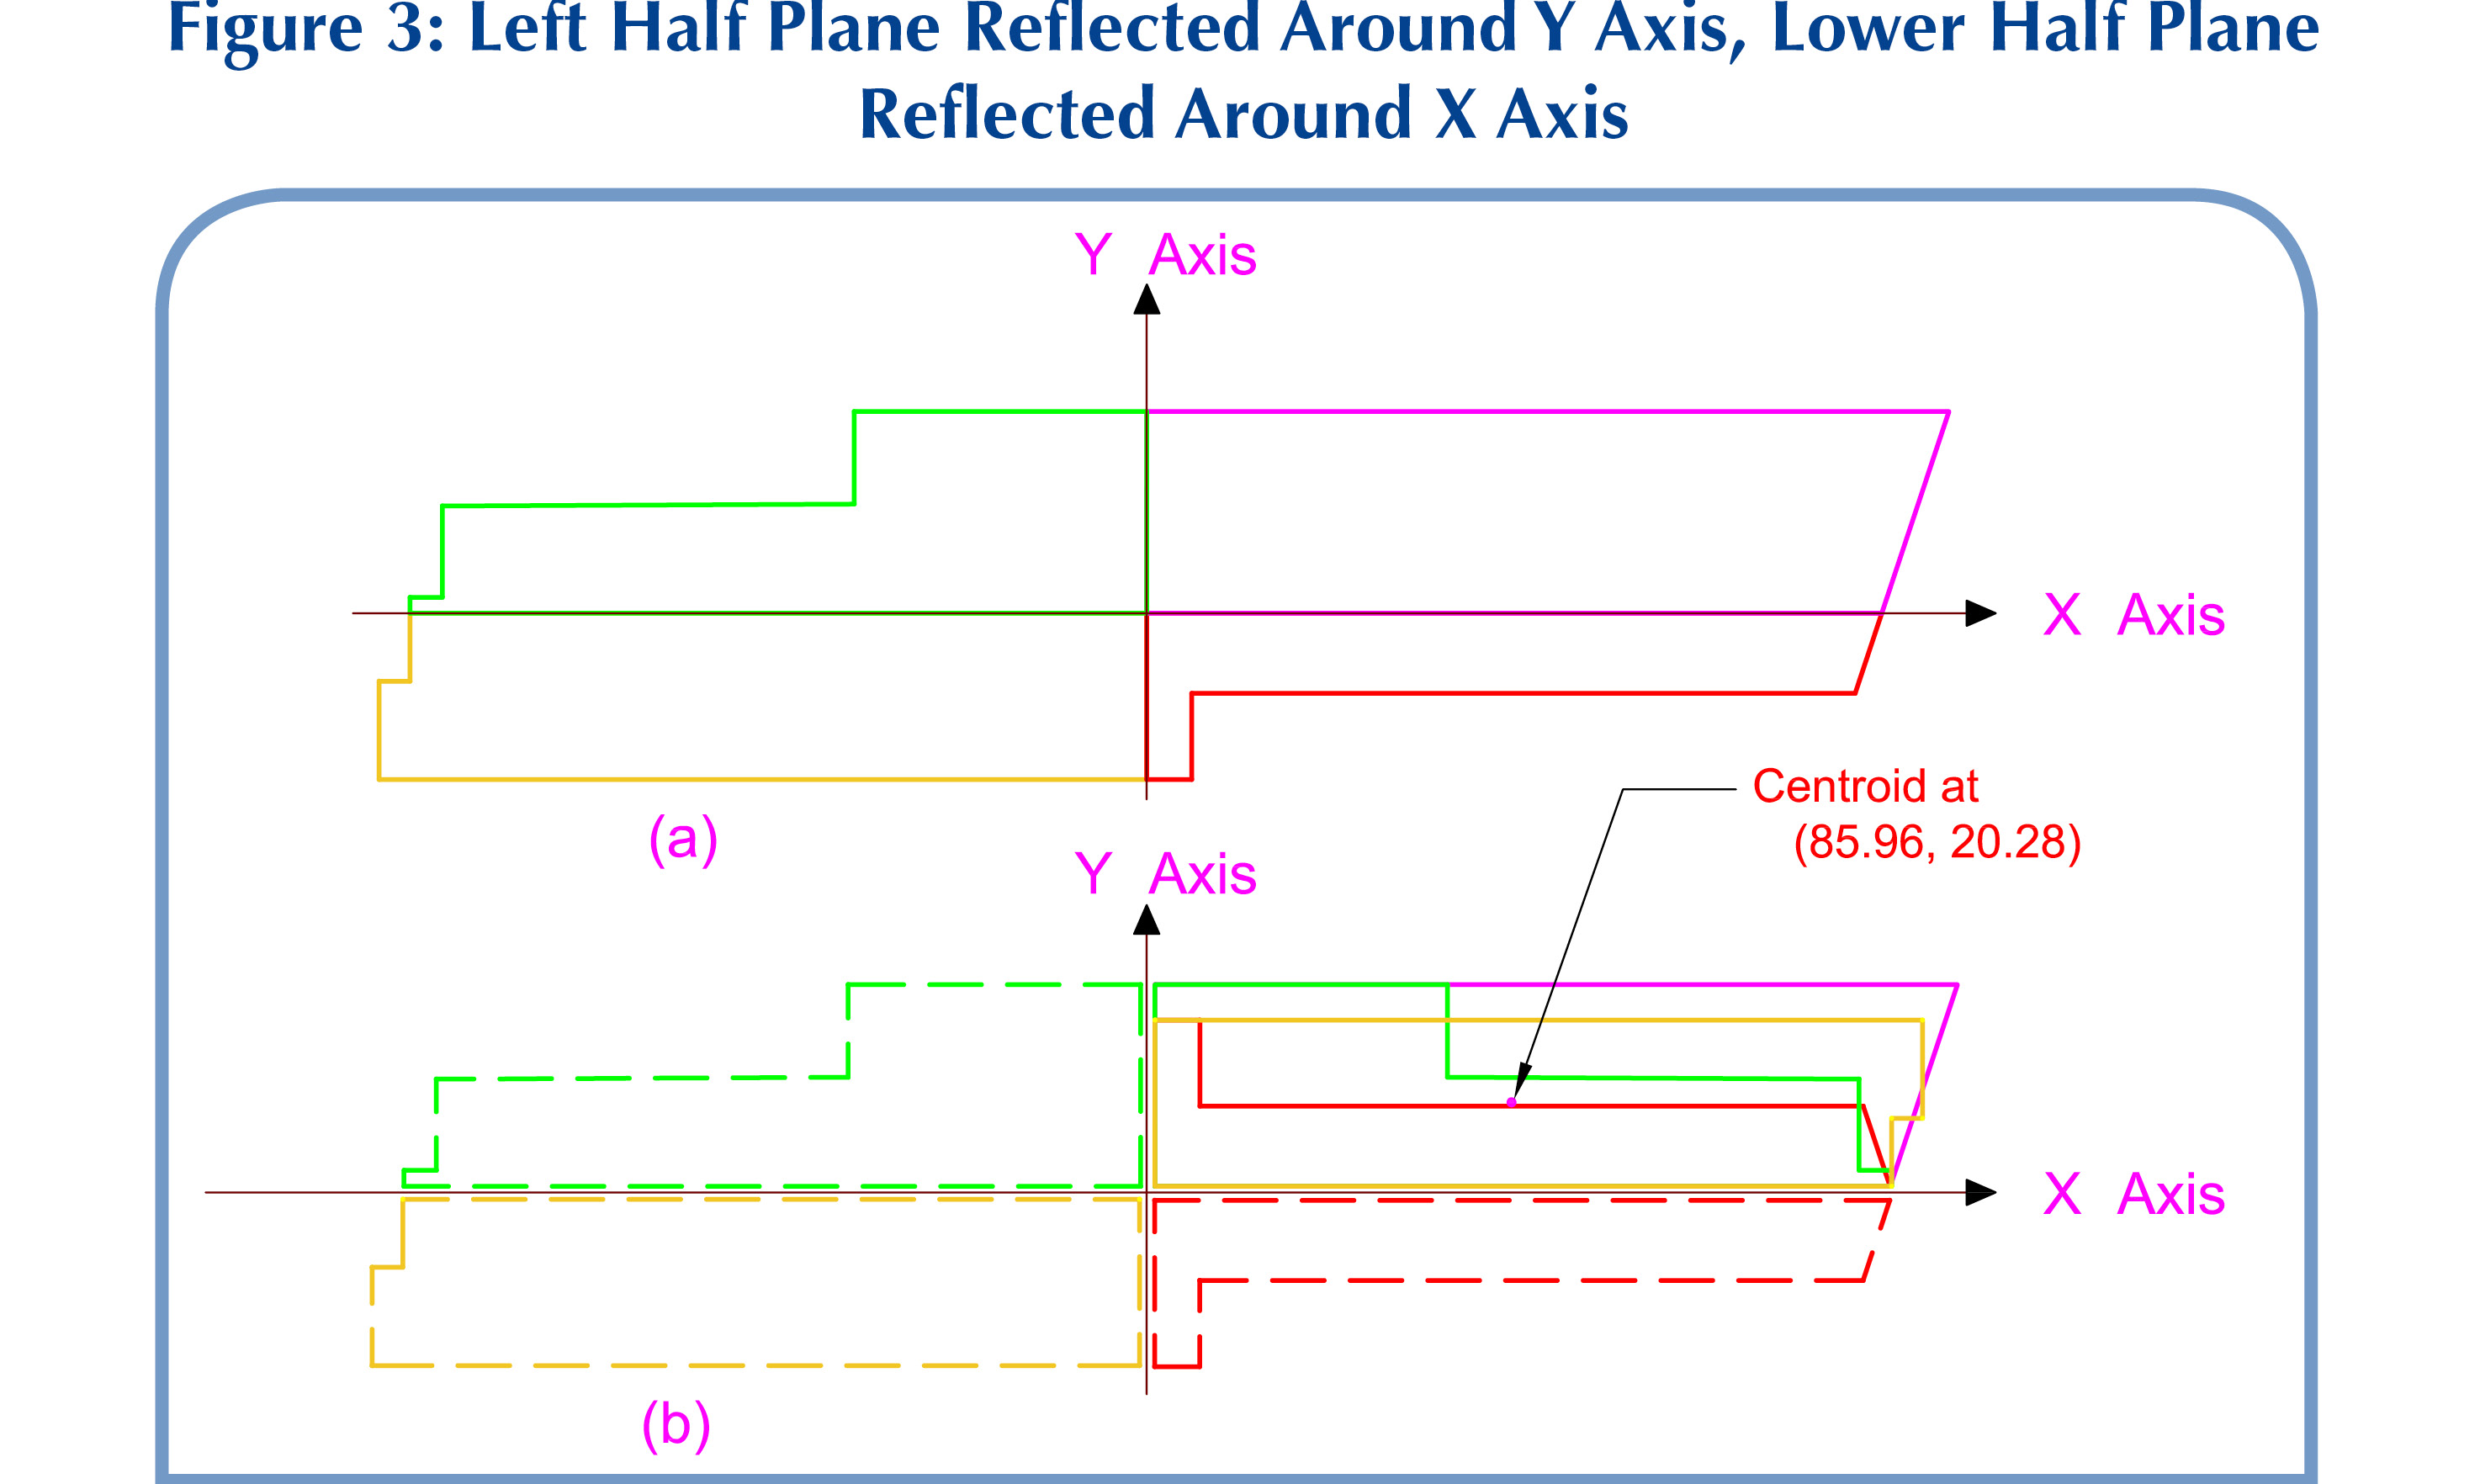
If working in AutoCAD, there is a much quicker way to find the average string length. Reflect the portion of the array that lies in the second quadrant around the X axis, reflect the portion of the array in the third quadrant through the origin, reflect the portion of the array in the fourth quadrant around the Y axis, and leave the portion of the array in the first quadrant unchanged. Reflection through the axes is done with the “MIRROR” command, and reflection through the origin is done as two successive reflections through the X and the Y axes. These operations can be combined and done somewhat more efficiently as first reflecting the array region in the left half plane around the Y axis and then to reflect the lower half plane around the X axis using the AutoCAD “MIRROR” command. Figure 3(a) shows array 1 of Figures 1 and 2 (modules are left out to avoid cluttering of the figure).

Figure 3(b) shows regions II, III and IV all reflected as previously described. The regions drawn in solid lines in the first quadrant in Figure 3(b) represent those three reflected regions, along with region I, which has remained unchanged. Applying the AutoCAD “MASSPROP” command to these four regions taken as one will give the coordinates of the centroid of the four as a whole. The coordinates obtained in this way are shown in Figure 3(b) as (85.96, 20.28) feet. The average string length for array 1 is given as the sum of the two coordinates, 85.96 + 20.28 = 106.24 feet, which agrees with the answer found through a lengthier process in Figure 2.
3) Optimal inverter placement
There is also a method for finding a location for placement of the inverter(s) that results in minimizing the average string length (and therefore minimizing the average string voltage drop) for the array.
Let’s superimpose a pair of rectangular coordinate axes on the solar field, oriented in such a way so that the X axis is parallel to the module rows and the Y axis is perpendicular to the module rows and with its origin at an arbitrary point within the array. With the coordinate axes placed, we will call the area of the array to the right of the Y axis S1 and will call the area to the left of the Y axis S2. If we move the entire array to the right by a small distance of ∆x, without moving it up or down (keeping ∆y = 0), it can be shown that the rate of change of the average of the X components of the distances from the centroids to the Y axis will be (S1 – S2) / S, where S is the total array area, or S = S1 + S2. The Y components will not change during this move, and therefore, their average remains unchanged. To be at a point where the average of the X components is a minimum (or maximum), the rate of change in the X direction needs to be zero, which means we need to have (S1 – S2) / S = 0. Clearly, this indicates that the necessary condition for this to happen is S1 = S2. In other words, the Y axis will need to bisect the array area.
Moving the array upward by the small distance of ∆y while keeping ∆x = 0 and following a similar argument as above, it can similarly be shown that to zero out the rate of the change of the average of the Y components of the distances from the centroids to the X axis, the X axis needs to necessarily bisect the area of the array, as well. Taken together, it is clear that the intersection of the two bisectors of the array area in the two principal directions is the optimal point for placement of the inverter. It can be shown that this point indeed minimizes the average string lengths and does not maximize this average.
I would like to point out that for array boundaries that are somewhat symmetrical with respect to the two principal directions, this bisectional point is quite close to the centroid of the overall figure. For example, in Figures 2 and 3, the distance between the overall array centroid and the bisectional point is only around 9 feet.

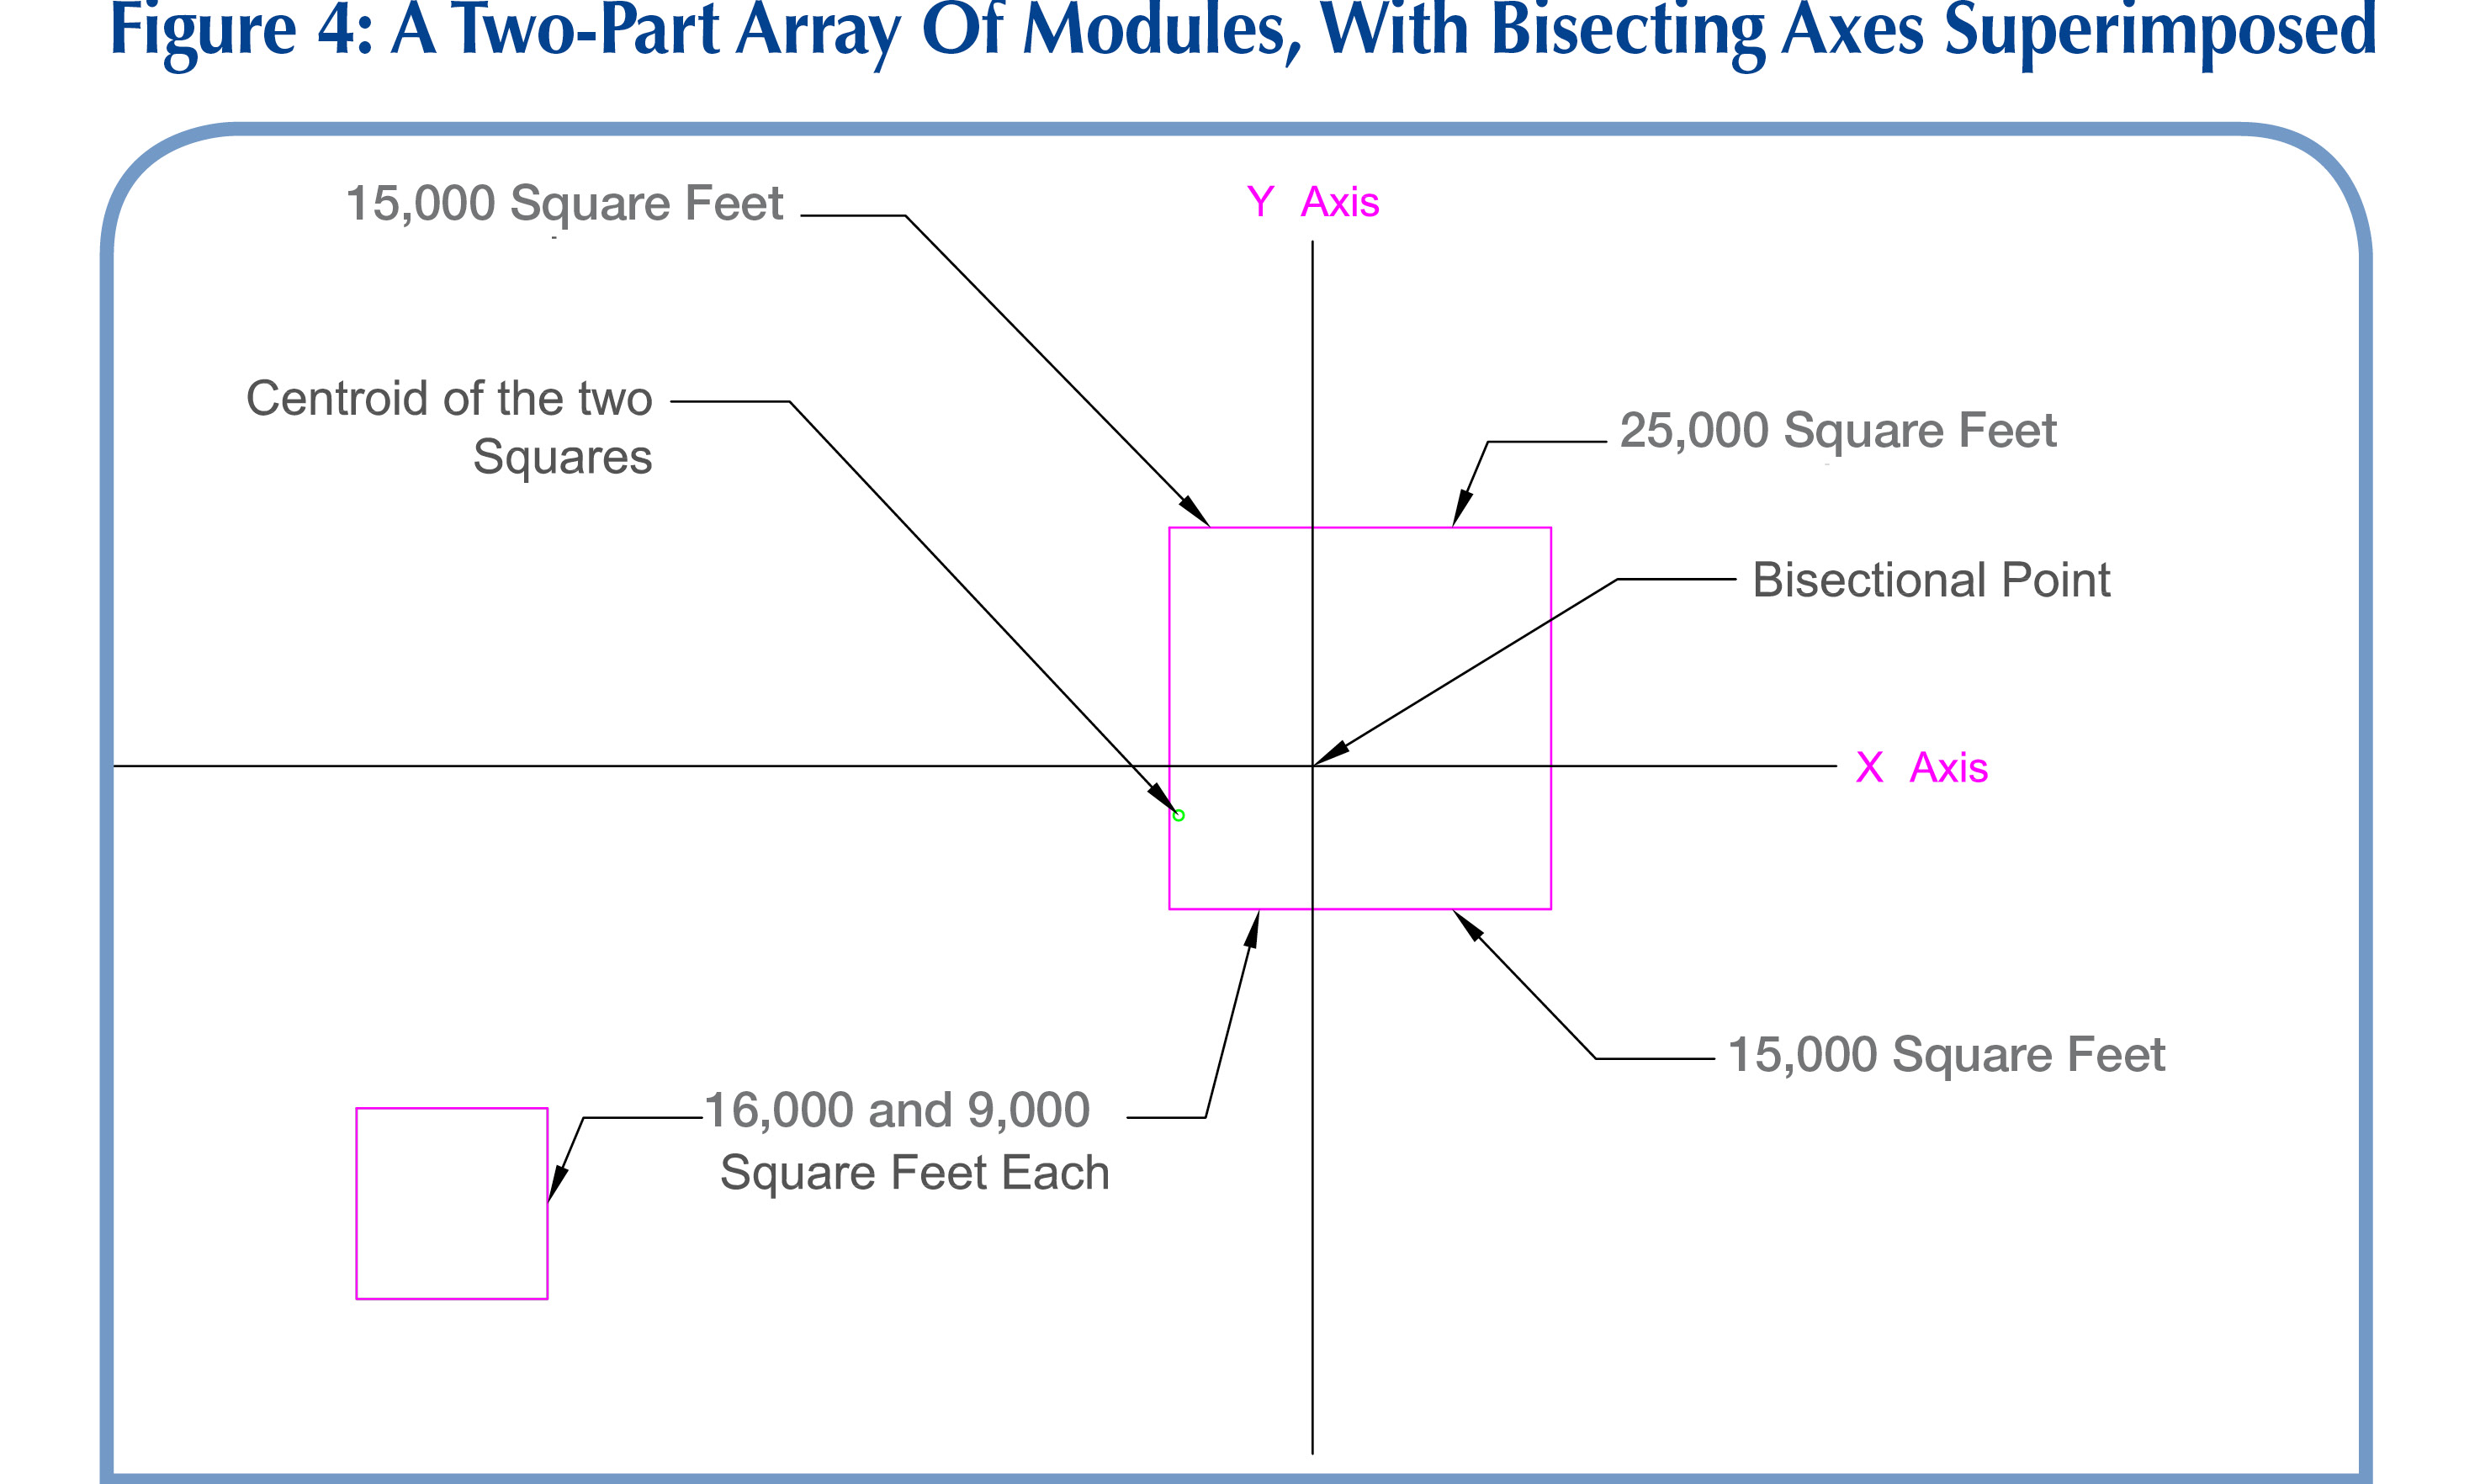
However, for very irregularly shaped array boundaries, and especially for arrays that consist of more than one sub-array of different surface areas, the optimal location of the inverters may not be obvious. The example in Figure 4 shows an array consisting of two squares with areas of 64,000 square feet and 16,000 square feet each, situated at a distance from each other as shown in that figure (modules are not shown to keep the diagram uncluttered).
The two area-bisecting axes are drawn as the X and Y axes in Figure 4. If the string inverters are placed at the bisectional point, the average string length is calculated to be 279 feet. This placement gives the lowest average string length and, therefore, the lowest average string voltage drop. Placing the inverters at the centroid of the two squares taken together (also shown in the figure) will result in an average string length of 308 feet. It is seen that placing the inverters at the bisectional point compared with the centroid will result in an average saving of 308 – 270 = 29 feet of string length per string, or 58 linear feet of string conductor per string, given that each string is made up of two phase conductors. In terms of percentages, the savings amount to roughly 9.5% of the total string length, with a similar relative decrease in the average string voltage drop.
Conclusion
Although it is a necessary task, verifying that a PV design complies with the maximum and average voltage drop requirements of the project can be quite time-consuming for large commercial- and utility-scale projects. The practical methods discussed in this article simplify and speed up the process. These procedures can also be used as a design tool to aid the designer in making judicious choices for placement of the equipment and in subdividing the solar field in appropriately sized and appropriately shaped arrays. Furthermore, the simple method for determining the optimal placement of the inverters (or combiner boxes) will minimize the average voltage drop of the strings of the array.
Project Design
Does Your PV Project Design Address Voltage Drops?
By Foad Alvandi
How to quickly check if a layout meets the maximum and average specifications.
si body si body i si body bi si body b
si depbio
- si bullets
si sh
si subhead
pullquote
si first graph
si sh no rule
si last graph