
301 Moved Permanently
The power market, especially in the U.S., is a highly disparate enterprise. At a certain level, a lot of things are similar. But even that is starting to change as certain utilities become more like transmission and distribution operators (see “Energy Planners Edge Toward A New Distributed Service Model For DG Solar,”).
Some are trying to get into everything. Some companies like NRG and NextEra are really interesting hybrids, where they are extremely strong on renewables in certain markets and then own regulated utilities that are extremely against renewables.
“It’s a fascinating market,” says Michael Herzig, founder and president of Hoboken, N.J-based Locus Energy. “Even though we are smack dab in the middle of parts of it, it wouldn’t be honest to say that we have our arms around all of it. I don’t think anybody does, because it’s changing pretty quickly.”
Locus, which develops data analytics software, is turning its attention to how to use its capabilities to enable better implementation of variable generation renewables - particularly solar photovoltaics - onto a stable and cost-effective grid infrastructure. According to Herzig, the success of these efforts in large part depends on the size and maturity of individual energy market segments.
“To be frank, a lot of this depends on the utilities’ receptiveness to using this information,” he says.
Changing focus
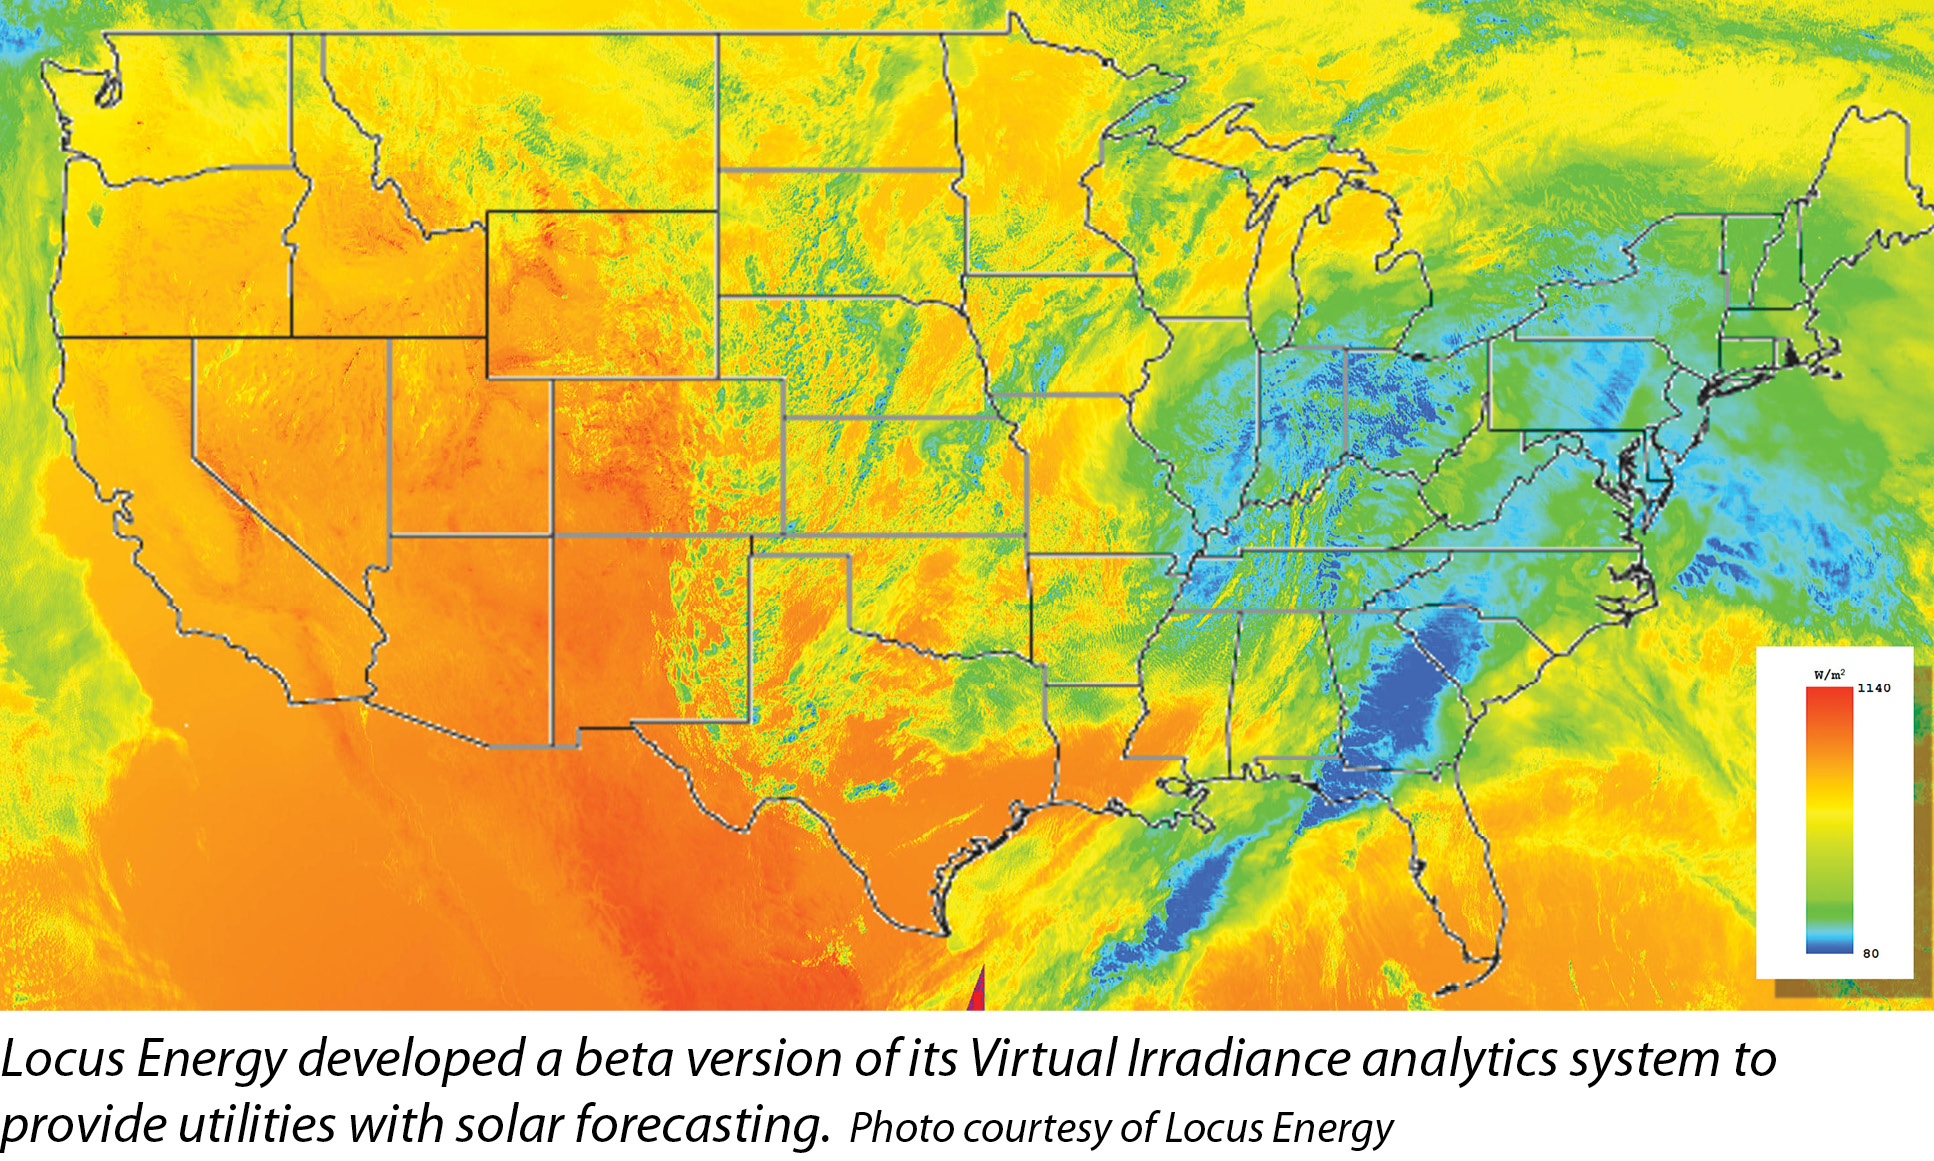
A couple of years ago, Locus built a forecasting engine related to its Virtual Irradiance product that takes satellite imaging and turns what is effectively a picture in four different wavelengths into the software’s interpretation of what that imagery was showing, such as cloud cover and atmospheric turbidity. Then, the forecasting engine could employ certain algorithms to report what production could be expected at any given pixel in the future - 15 minutes, 30 minutes, two hours, etc.
“We thought this would be a really cool technology to help the utilities understand the impact solar was having or would have on particular distribution lines,” Herzig says. “Even without that forecasting engine, you could use the software platform to have a ‘shadow fleet’ to understand what had happened in the recent past with renewable assets. Because they change fast, especially in the Northeast.”
Herzig says the concept has generated a lot of “high-level expressed interest,” but the energy market is still in its early days in terms of how the utilities would employ such a product to good effect. However, as the utilities figure out what their strategies are with regard to renewables - whether it’s jumping into solar with both feet and investing in some of the third-party owners, simply meeting the basic requirements of the mandated renewable portfolio standard, or putting up as many barriers to renewables as they can - this is where the patchwork comes in.

“Once solar gets to a certain penetration level, the utility almost needs this data,” Herzig says.
Looking forward, Herzig says analytics tools are going to be really critical. But in terms of where the energy market is today, the instruments are a little bit blunter. If you take Hawaiian Electric Co. - soon to be NextEra - as an example, instead of saying, “Give us the data and we’ll figure out where we can put more PV on,” the utility essentially says, “We don’t want the real-time data or the forecast data; we’re just going to call a halt when PV hits a certain level on certain feeder lines.”
Utilities currently have quite sophisticated means of gathering information on consumption by distribution or feeder line. The ability to handle this data with any granularity down to the distributed generation level tends to be much more limited. What would utilities do with the aggregate data from the feeder lines based on an understanding of renewables?
“How much would that move the needle in terms?” Herzig says. “As utilities get more sophisticated about how they integrate renewables, data analytics are going to become much more important.”
Gaining insight
Steve Ehrlich, senior vice president of marketing for Space-Time Insight, a San Mateo, Calif.-based producer of data analytics software, says that like it or not, utilities are going to have to become more proficient in understanding how electricity is produced and consumed at increasingly fine levels of detail.
“It is one thing to know that when you roll out two million smart meters that you will receive a certain amount of data per meter, and there is a defined set of value you can derive from that data,” Ehrlich says. “But when electric vehicles, smart buildings, smart homes and smart cities come along, the issues are many times more complex.”
Space-Time Insight develops software for use by utilities and grid operators to understand data from its infrastructure, such as the grid and smart meters, combined with input from enterprise systems, such as asset or customer databases, and external data, such as weather, temperature and other local conditions.
“All of that data is essentially correlated and analyzed spatially and over time,” Ehrlich says.
From a spacial point of view, the information includes the weather conditions of a given neighborhood, what customers are there and what distribution assets feed into it. Temporally, the system has access to historical usage data from the neighborhood and new data as it comes in. This combination enables planners to appreciate what happens in a location with certain sun and temperature conditions.
Ehrlich says the system can incorporate predictive analytics to look at what the utility can expect going forward by comparing it with historical data with very fine levels of detail. Finally, the utility is able to perform a nodal analysis to understand the implications upstream or downstream of customers connected to a specific asset.
“If I am expecting X amount of power to be generated in a particular area, what do I need to do to balance the grid elsewhere?” Ehrlich says.
For example, an operator could use the system to drill down and discover which customers participated in the last demand response (DR) campaign. Customer participation could be evaluated against any number of variables that might have contributed to or hindered participation. This information could then be used to develop a new campaign with more realistic or focused goals. It could also be used to identify who the best candidates for a DR campaign might be.
The number of data points required to achieve this level of detail is daunting, however. On the back end, the Space-Time software platform has data adapters that take data from weather feeds, smart meters, etc. On the interface side, it displays information visually through maps, charts and tables.
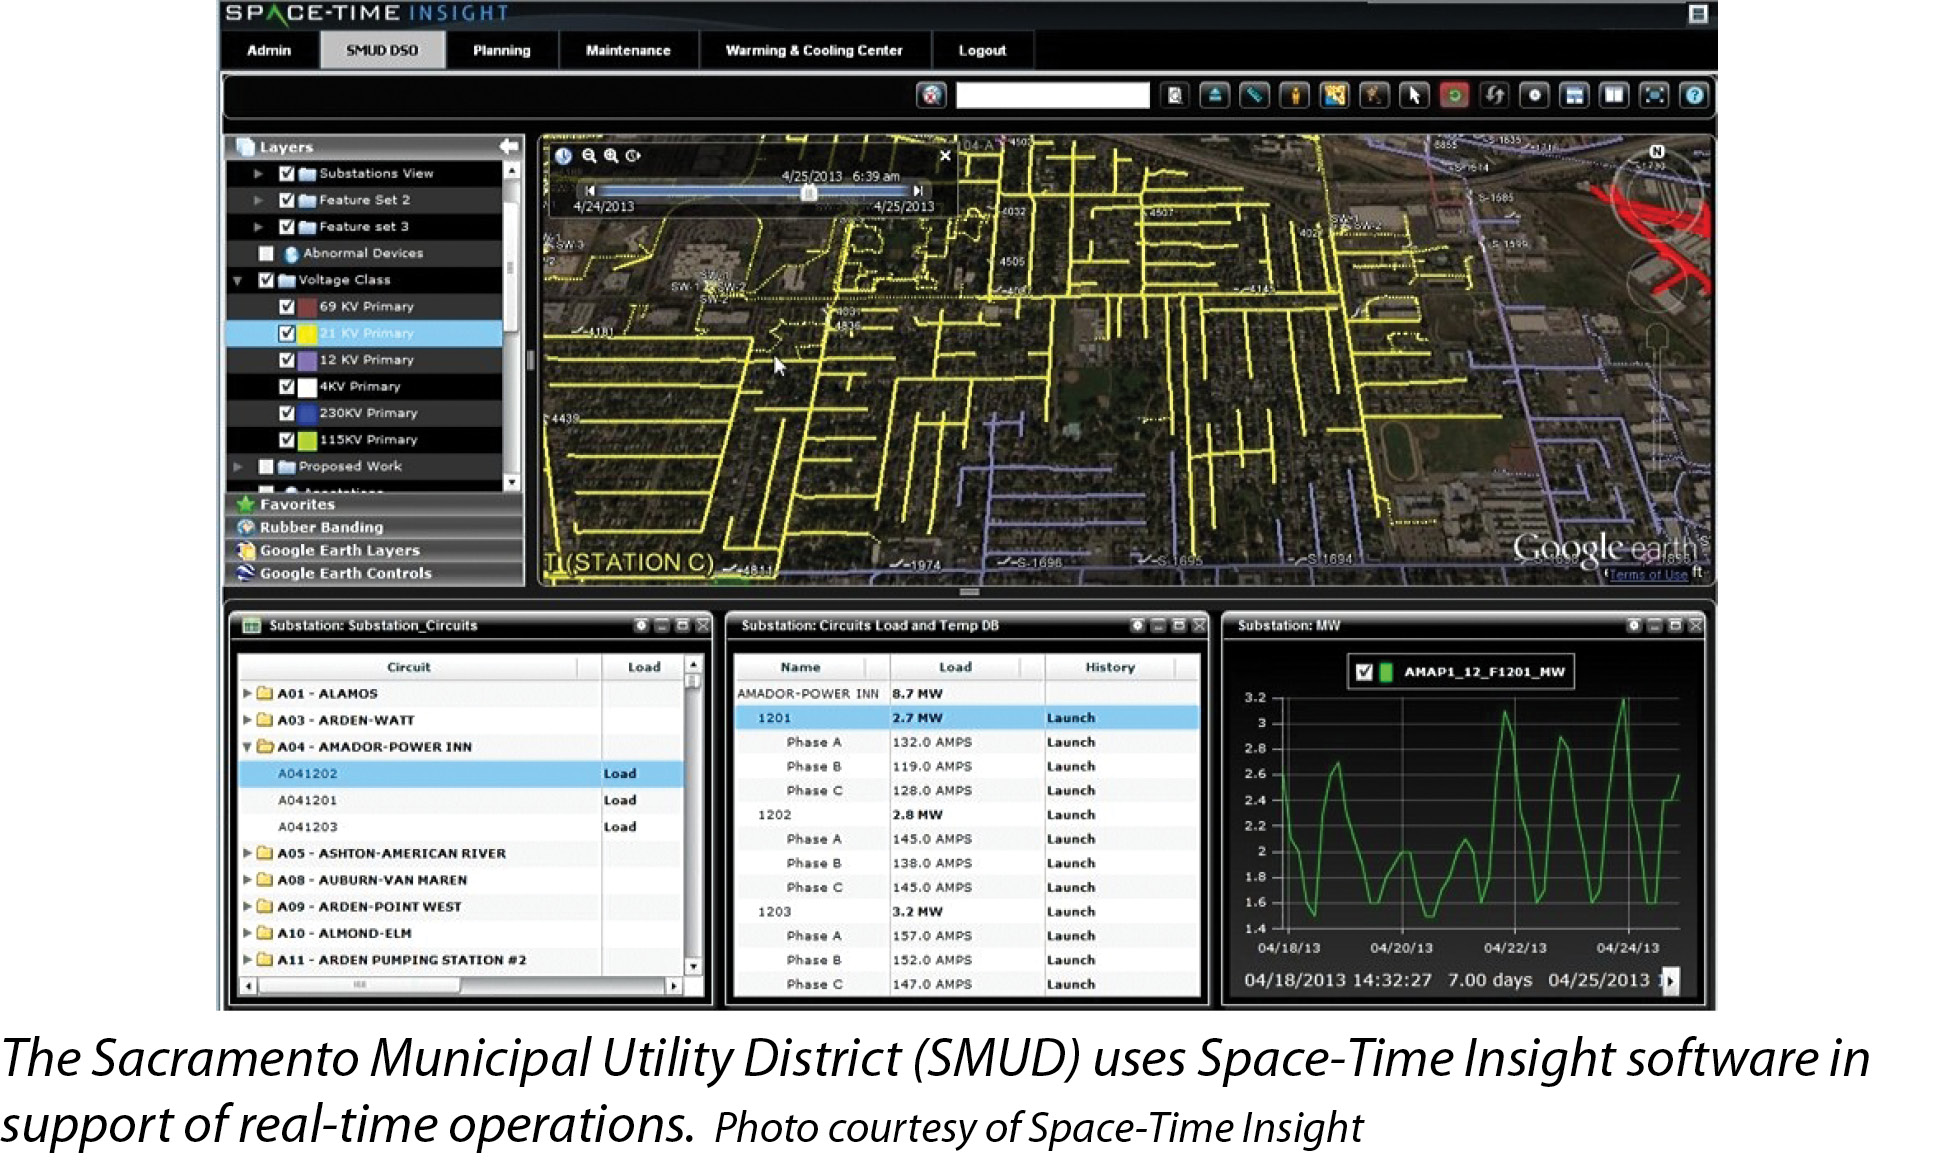
Space-Time Insight has customers at one end of the spectrum, such as the California Independent System Operator, that use the system for planning purposes. At the other end, customers such as the Sacramento Municipal Utility District (SMUD) use the system in support of real-time operations. In the latter case, SMUD is able to pull in data from the department of motor vehicles to see which of its customers have purchased an electric vehicle.
“You plug in your Tesla, it has an impact,” Ehrlich says.

Altering behavior
Gaining more insight into customer electricity usage is not only important for grid operations and planning, it is necessary to incorporate ratepayers into the process. Particularly as distributed solar penetration increases, customers have more of a stake in how their electricity is produced as well as consumed. In essence, consumers have a role to play as planners in their own little corners of the grid.
Steve Nguyen, head of marketing for Bidgely, a developer of analytical software in Sunnyvale, Calif., says an obstacle to this planning model is that customers really have very little information about how the electricity they use is allocated with any specificity.
“If you look at the way the utilities have evolved over the years, with a lot of smart and automated meter reading systems, they don’t give consumers a tremendous amount of information,” Nguyen says.
Bidgely produces a cloud-based software platform primarily for utilities. The initial goal was to make smart meters smarter. Automating metering infrastructure doesn’t give consumers a tremendous amount of information. It tends to provide utilities with a means of monitoring overall electricity usage within defined intervals. But it really doesn’t tell anybody what is actually going on inside the home.
Information has been coming out in waves, Nguyen says. The first wave was collecting the information, while the second was distributing information to ratepayers, which enables them to evaluate where their usage stands in relation to their neighbors’ usage. This has given people some options about how they might want to alter their behavior based on the comparisons. The third wave, Nguyen says, is to perform a disaggregation analysis on the usage waveform - the spikes and the swells and the duration - alongside environmental factors, such as temperature, humidity, wind speed, etc.
“We can take this ‘third wave’ information and figure out what is actually using the electricity at a given moment,” he says.
The information is provided to utilities as a service, which, in turn, can provide it to ratepayers through customer-facing portals. So, instead of the consumers seeing their energy usage as a “black box,” they are going to be able to see very specific information, such as how much electricity the air conditioner used during a 24-hour billing cycle, year over year. The information provided through the portal can cover essentially every plugged-in appliance in the house - refrigerators, dryers, furnace, pool pumps, etc.
“The consumer has much greater insight into usage,” Nguyen says. “The beauty of this from the consumer’s prospective is specific knowledge of what is using the most electricity and when. From the data analytics perspective, because that information is captured in our database, we can apply heuristics, machine knowledge, machine learning and behavioral science to be able to offer very specific advice about what the consumer can do to reduce consumption.”
Information provided to consumers through the portal might include advice on when to run the dryer. Or perhaps, the utility could inform the customer that the dryer appears to be increasing its energy use and, thus, might be out of kilter or getting long in the tooth.
From the utility’s perspective, Nguyen says, they can see which ratepayers are consuming a lot of electricity with specific appliances at certain periods of the day and then better target incentive, demand-side management and energy-efficiency programs. “When the information is specific, it comes across like a real partnering effort and less like junk mail,” he says.
Analytics and big data are likely to have an important role to play in developing policies and incentives governing PV deployment going forward. A lot of the data analytics systems on the market developed for one purpose may be adapted for PV planning and services design purposes in the very near future.
Loading data
Locus Energy’s Herzig says the company software as currently configured is intended primarily for the PV operations and maintenance (O&M) market. However, the same data collection means and analytical tools O&M service providers use for monitoring a portfolio of PV assets are directly relevant to operators working to make PV a better citizen on the grid.
“How the PV interacts with storage and even nearby grid storage - which, I think, is coming extremely fast - is going to be a key area for the sorts of data analytics products we provide,” Herzig says. “Issues such as identifying peak load on a particular feeder line and managing panel facing to effect better load balance are going to change as storage becomes more prevalent. Storage is a ‘when,’ not an ‘if.’”
Herzig says the really exciting role for analytics is going to come from figuring out what the PV and the storage are going to do together. At the end of the day, a user with even a moderate amount of storage deployed is going to want to maximize energy production as opposed to east-west-facing, where it maximizes interaction with the load of the day.
“The question of when do you load up the batteries and whether you use the PV is going to be answered by analytics,” Herzig says. S
Industry At Large: Analytics For Energy Markets
Analytics And Big Data Are Changing The Energy Market Map
By Michael Puttré
Software developed for grid operators, asset managers and customer service can help integrate solar more effectively.
si body si body i si body bi si body b
si depbio
- si bullets
si sh
si subhead
pullquote
si first graph
si sh no rule
si last graph