
301 Moved Permanently
Many know about - or are experiencing - the familiar end-of-year building rush right now, but this year’s sprint will not end on New Year’s Eve like it did last year.
Instead, we are in for an 18-month race that will see the largest volume of megawatts yet installed across the U.S. Spurred on by not only the sunset of the federal investment tax credit (ITC) pushing existing projects to completion, but also by the brand-new projects cropping up in states and regions that become viable each day through ever-lowering system prices or new local last-minute policies and mandates.
Developers need to be looking ahead to appreciate how big this wave will be, to determine which new markets will be adding fuel to the fire and to identify which parts of the solar value chain will be squeezed in the next 18 months. There are strategies for avoiding costly supply and demand-related issues based on lessons learned from markets that have already passed local incentive cliffs.
This is going to be an amazing time in the history of the industry, and careful planning and forethought will help us all to make the most of it.
The shape of things to come
To understand and predict what will happen as the ITC comes to an end across the country, it is helpful to look at other more regional markets and see how they behaved as their local stimulus policies and incentives changed or went away. Several states, such as Massachusetts, New Jersey and North Carolina in particular, are in the process of ending local incentive programs or have already ended them.
Massachusetts, for example, saw nearly double the megawatts installed in 2013 through 2014 compared to previous years as the deadlines approached for its successful solar renewable energy certificate program. New Jersey offers another good case study. In 2012, when time was running out on the under-supplied Solar Compliance Alternative Payments system, there was a tremendous spike in installations compared to previous years.
Of the three states, North Carolina is perhaps one of the most analogous examples of what could happen nationwide in late 2016. The state’s solar tax incentive program is set to expire in a scenario very much like the ITC. This major deadline in North Carolina is causing a significant building boom and is setting the state up to break last year’s install record by two times or more. This dynamic is significant when you consider that nearly 400 MW were installed in North Carolina in 2014.
Each of these states’ “cliff years” saw a 135% to 180% increase in installations over the prior year. If this trend extends nationally in 2016, installations could see a similar increase over 2015 levels. Analysts project 12 GW of new installations - about 150% of 2015 values - will be implemented in 2016, with over 5 GW coming from the utility-scale solar market alone.
There may be factors that push that figure even higher from markets that are just now picking up a head of steam with a year-and-a-half to go until the ITC deadline. Starting development now, just before a cliff, in a new market may sound foolhardy. However, consider that many places in the U.S. do not face the long development time frames we have seen in California, and in some places, fast-tracked, grid-competitive solar starts to make sense.


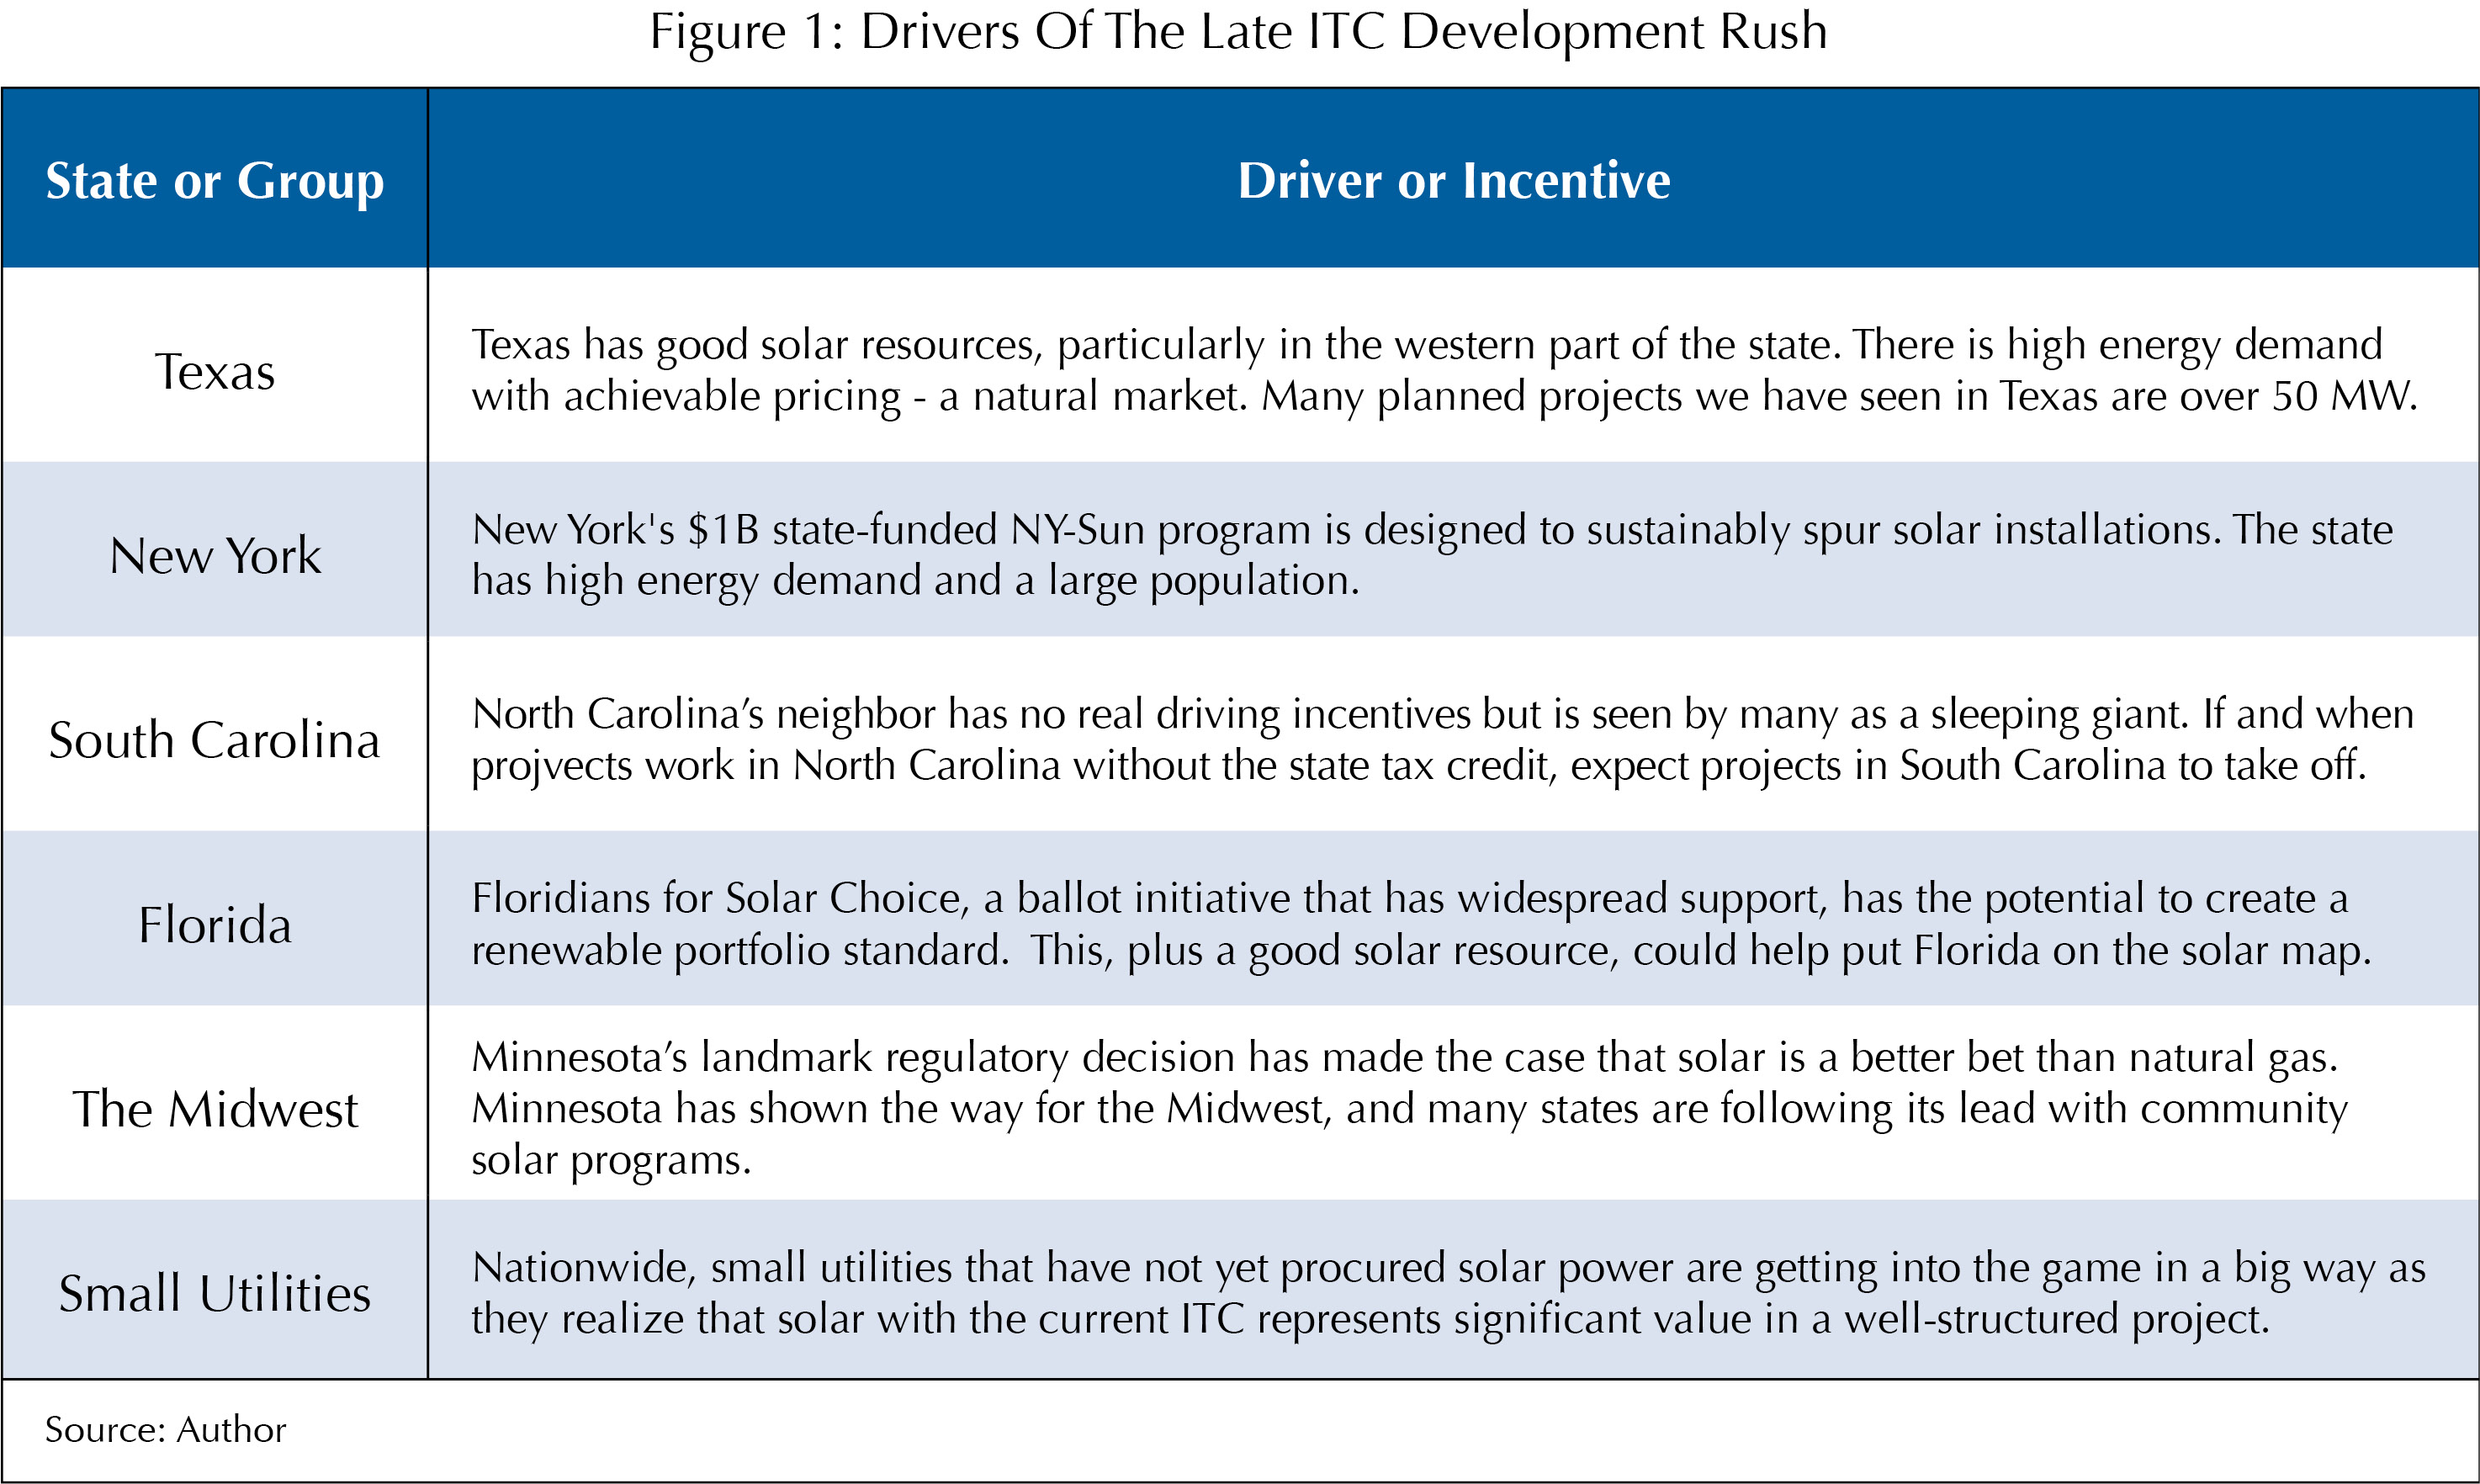
In addition to wrapping up existing projects in North Carolina, California and Minnesota, there are at least five other states and regions that have real potential to bring even more megawatts into consideration. This new capacity will put even more pressure on the market, exacerbating potential supply and demand issues.
Some of the promising states and regions we think everyone should keep an eye on are shown in Figure 1.

The building booms in New Jersey and Massachusetts were not so taxing as to create significant shortage or supply problems for affected developers and installers working to get their systems online by the deadlines. North Carolina, however, is proving to be a different story. The over-500 MW of real volume is straining with the looming incentive cliff and the typical national construction upswing in the second half of the year.
Plan to move quickly
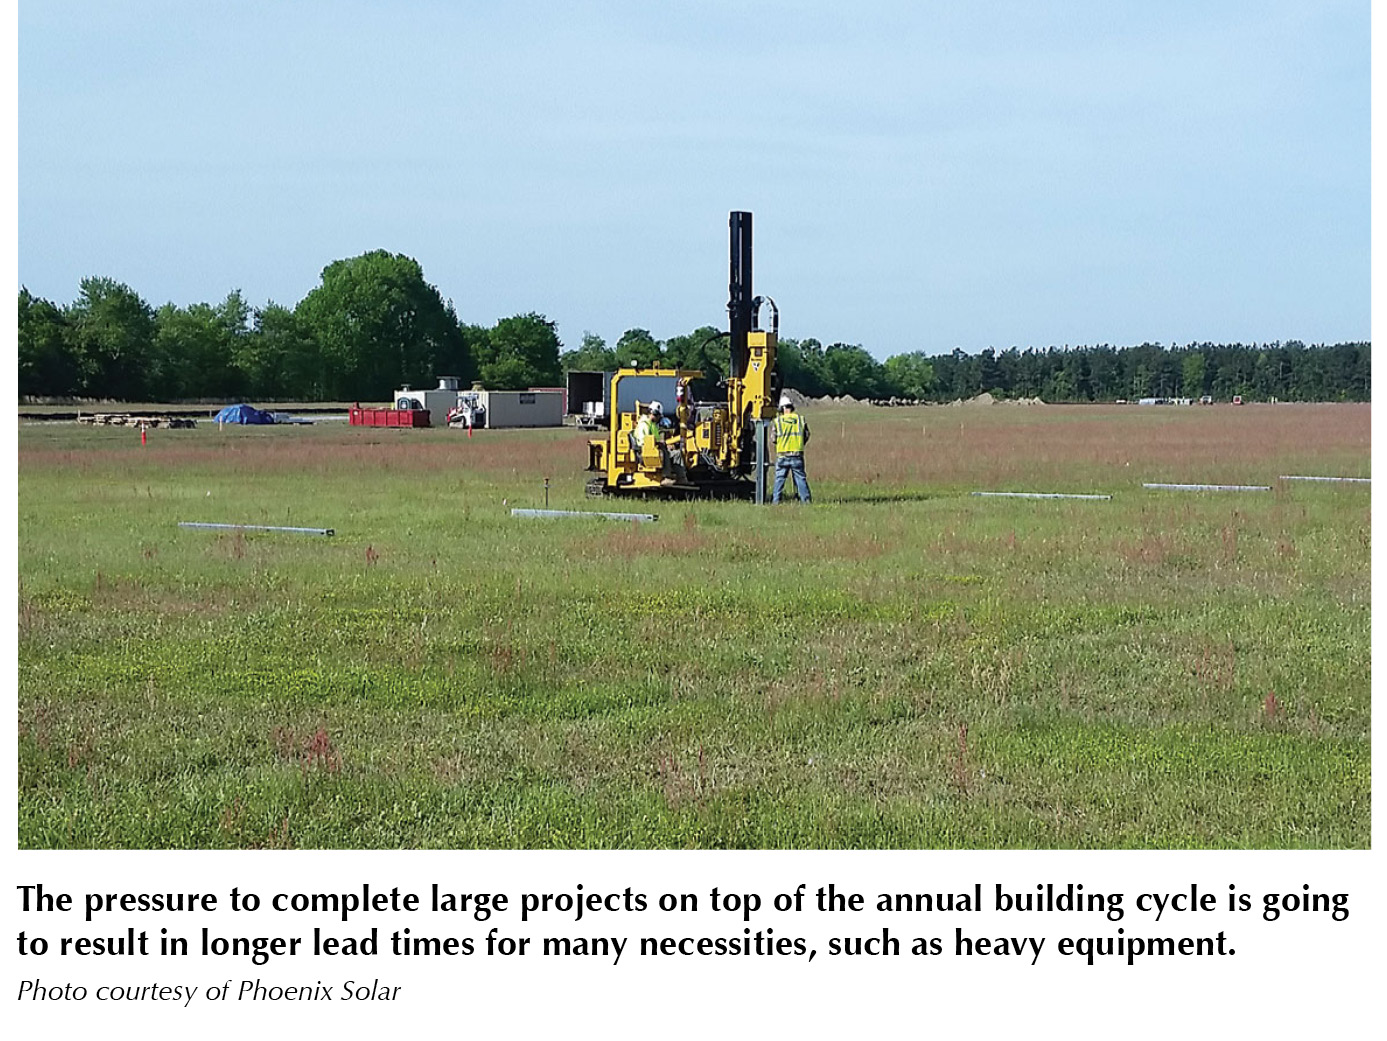
The sheer volume of projects is causing a situation where availability of local labor may become limited. At the same time, the nationwide annual building cycle is producing shortages of some equipment, such as transformers, and is starting to require longer lead times. Mitigation of these issues - not to mention unforeseen delays - requires careful consideration and the timely execution of agreements to make sure deadlines are hit.
Across the country in 2016, the story will be similar to what is happening in North Carolina with labor supply and equipment facing shortages. With 12 GW of volume going in, the modules that make up more than 50% of these projects’ installed costs could prove to be an additional supply bottleneck that has the potential to significantly affect installed price.
Modules have enjoyed a bumpy road since tariffs were announced for Chinese suppliers at the beginning of 2014. However, prices have continued to come down even through the last six months. Now, however, this trend is starting to slow - and specifically for the purchase and delivery of modules this year, prices have stopped decreasing.
With practically only one quarter left to place purchase orders for projects seeking completion this year, price increases should be expected. It is hard to predict if 2016 will show a similar situation, with prices decreasing early in the year then flattening out in the end. A “middle of the road” guess may be that modules will decrease in price in the first quarter of 2016 but trend flat or up earlier by one quarter compared to 2015, given the volume predicted at the end of 2016. The potential impact of both labor and module behavior on total installed system prices in 2016 suggests that prices could begin to face upward pressure as the clock ticks toward Dec. 31.
Albie Fong, U.S. national sales director at Japan-based module manufacturer Solar Frontier, expects a gradual price decrease for crystalline silicon (c-Si) modules in the U.S. However, high demand to get projects completed before the expiration of the ITC, along with China furthering its global solar market lead, may hold prices relatively flat.
“That will open up project opportunities for leading thin-film manufacturers that can offer systems with a competitive levelized cost of energy compared to c-Si,” Fong says.
Although creating urgency is a cornerstone of many sales pitches, it is our honest opinion that to avoid the 2016 construction squeeze, contracts should be signed early with special consideration given to project schedules and lead items. Engineering, procurement and construction (EPC) firms; module suppliers; and other value chain suppliers are already predicting a point before the end of the year at which they may be booked up in 2016.
On the customer side, many large portfolio owners heeding this advice are securing key supplies early and across their portfolios.
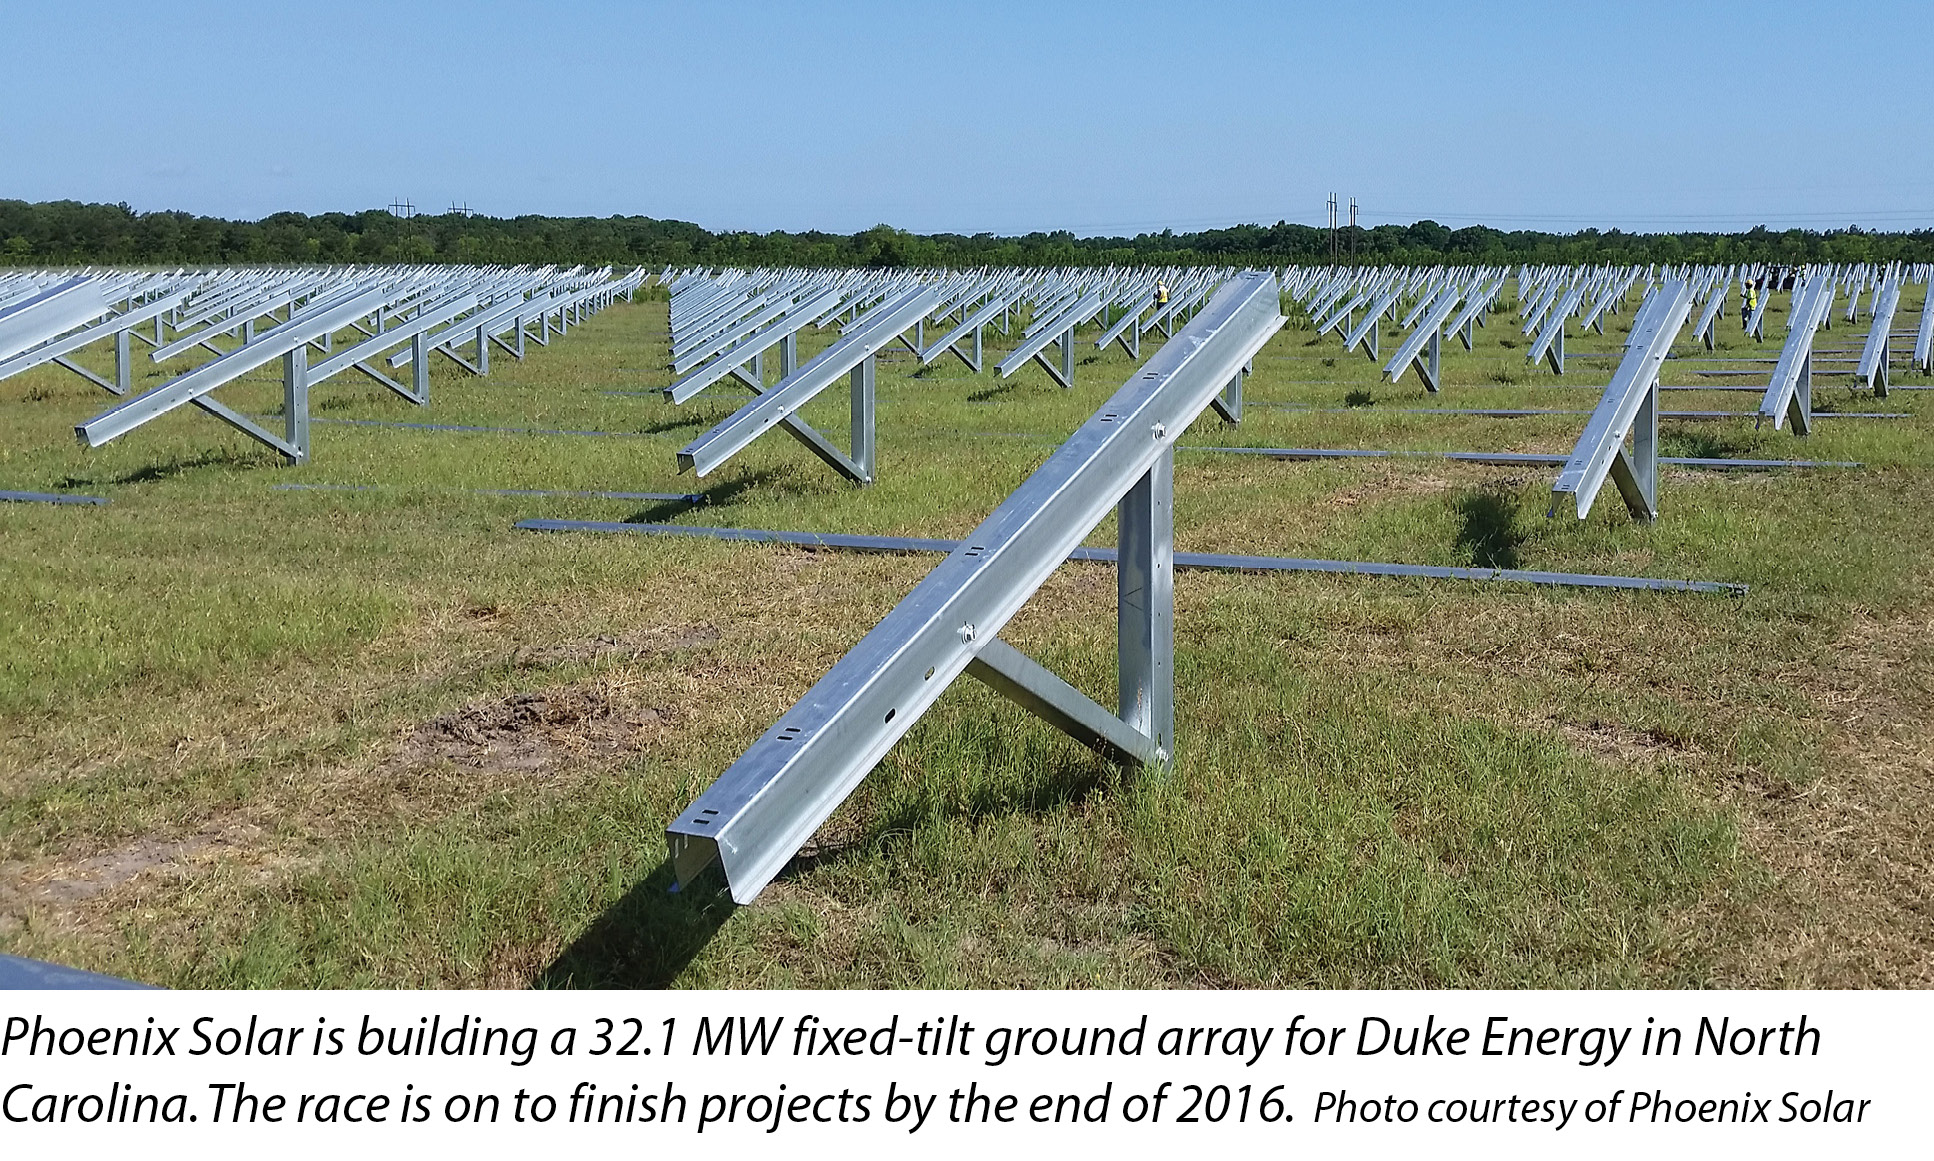
We at Phoenix Solar are building right now in North Carolina, a market that is very much in the middle of a cliff year. Despite customers’ best efforts, projects have dragged out to the final minutes of execution windows. This situation may repeat itself across the country in 2016, and we plan to use the same strategies we developed in North Carolina this year to shorten projects’ construction time frames. We have had to rethink everything from design all the way through to how we commission a facility.
However, last-minute execution of projects opens up all sides to some risk, and the key message is to reach out to your EPCs and suppliers early. When the project pencils, do not “fix it” - execute as if there may not be a second chance. Great things may come to those who wait, but where 2016 is concerned, book your deals now. S
Solar Construction
Get Ready For The Great Solar Construction Squeeze
By Jesse Tippett
Book your deals now, and reach out to your service and equipment suppliers before you get left in the dust.
si body si body i si body bi si body b
si depbio
- si bullets
si sh
si subhead
pullquote
si first graph
si sh no rule
si last graph