
301 Moved Permanently
The military concept of actionable intelligence - information cherry-picked from the noise that you can actually do something with - has been picked up by the business community in various forms. The concept also applies to the vast quantities of data collected from photovoltaic power plants.
Monitoring systems have long been a feature of PV power installations, from residential portals through supervisory control and data acquisition (SCADA) platforms for large-scale facilities. In all cases, the function of the monitoring system is to provide a window into the performance of the plant.
As these monitoring functions become more sophisticated, the information gleaned from them could be used to gauge the overall health of the plant. As these data points become finer and encompass more aspects of plant functions, the status of individual components comes into focus. By and large, the primary consumer of this information has been the operations and maintenance (O&M) team, which uses information from monitoring systems to schedule service and roll trucks on alarms.
Asset managers have emerged as another class of monitoring data consumer. In this case, the motivation is to understand how a plant - and more typically, a fleet of plants - performs with regard to its predicted and contracted output. Such users are receiving the information from the same sources, but it’s configured for their requirements.
Increasingly, PV plant owners and operators are using the data gathered from monitoring systems as a means of improving plant performance. The same data points produced for other functions can be analyzed in real time or over a period of time to discover opportunities for improving overall plant performance or optimizing it for certain conditions. This relatively new application for monitoring data is spurring demand for new analysis methods to make the intelligence more actionable.
Opening the window
Adrian de Luca, senior vice president of sales and marketing for Locus Energy, a New Jersey-based provider of data acquisition and analysis systems for PV plants, says gathering the data is always the first step. Nothing can happen until the data is gathered. There is a lot of value in just being able to gather data from lots of different systems and configuring it. You also have to normalize that process for storage and retrieval and work out how to give customers access to it.
“From there, it splits because you have customers who have very, very specific and keen ideas about how they want to run O&M across the fleet,” de Luca says. “They have their own ideas about how they are going to build their own reports, and what they really want is just ready access to that data. They don’t want any limitations on how and when they can retrieve nor on how they can shape and mold it. They just want access to the raw clay.”
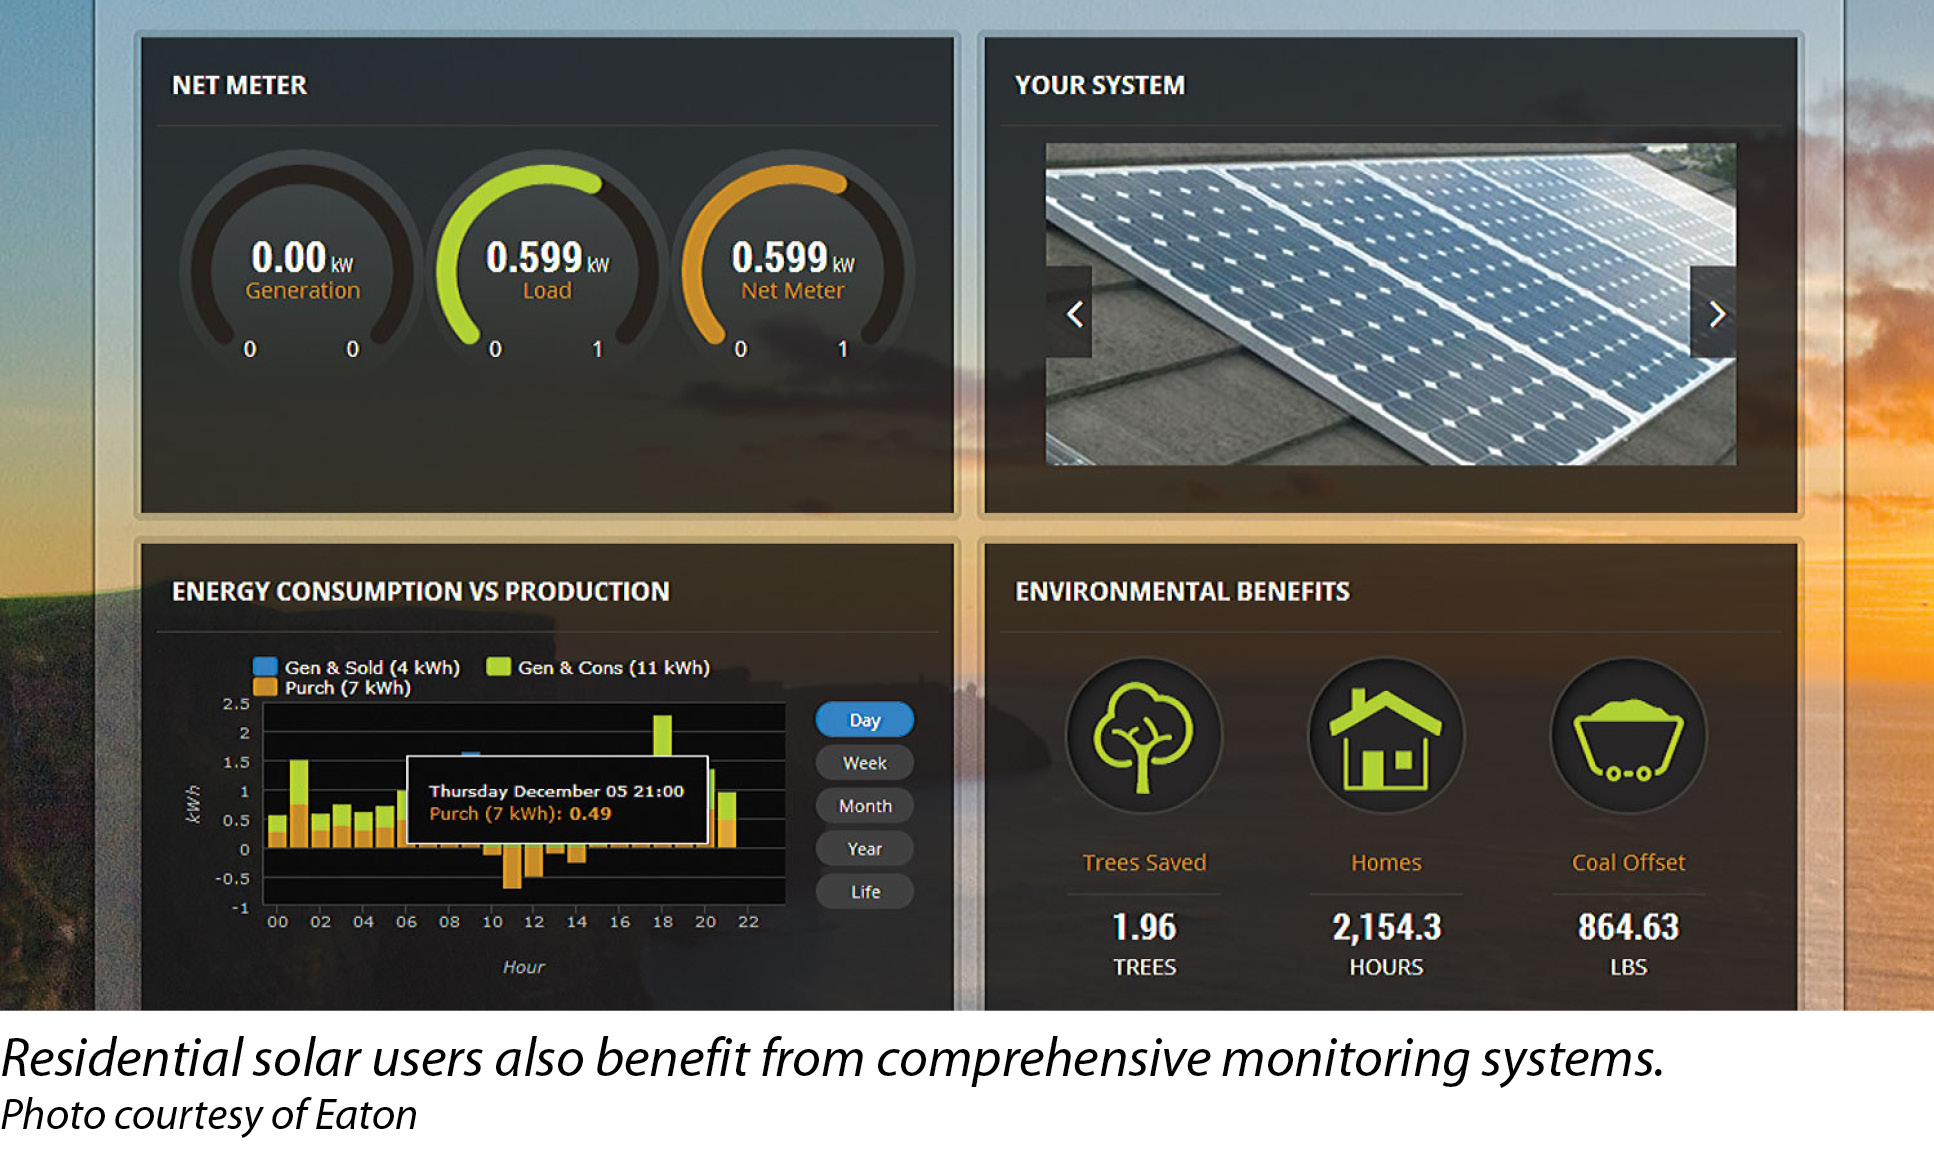
On the other side of that spectrum, you have smaller customers or those who are still coming up the curve of experience and maybe haven’t developed the full set of best practices yet. They typically want to just have the information rendered logically on a screen for them to look at and make some basic decisions on. As these customers learn more, they can ask more from the platform in terms of accessing the data and doing their own things with it.
“When you think about the overall metric for performance, it’s really a financial one,” de Luca says. “Is the system maximizing its yield? Over the life of that asset, you have to include what it costs to maintain the plant as part of that calculation.”
At the most basic level, an O&M provider and an asset management team report periodically on a plant or a set of plants. The savings and efficiencies here come when you hit some sort of scale. Locus Energy has developed an application that allows users to quickly populate performance data into an Excel spreadsheet. Plant operators can then apply their own performance models and metrics. Direct access to the Locus database via spreadsheet streamlines periodic operational reporting, which, de Luca points out, is a primary function of O&M providers and asset managers.
“By reducing the O&M burden on the plants, you are increasing its overall return,” de Luca says. “That is the primary lever by which all of these companies using monitoring platforms of one type or another boost plant performance. To use a car analogy, it would be nice if you could use a better fuel or add a turbocharger. There just aren’t those mechanisms for solar. There, you focus on minimizing downtime and any cost associated with operating the plant.”
Riding the feedback loop
Robert Wood, chief technology officer for Trimark Associates, a California-based provider of SCADA and monitoring systems for large-scale PV plants, says a greater number of clients are requiring access to actionable intelligence on their assets.
“Our approach is to monitor everything that is going on at the plant but also to allow clients to then take action on that in order to use that information to optimize the performance of their plant,” Wood says.
According to Wood, the company’s clients increasingly have more technical capability to affect the control elements of their power plants. The ability to exercise more effective control of a plant starts with understanding what is going on at the point of interconnection.
“Part of this issue is knowing what is going on at the plant, but another part of the problem is knowing what is going on at the grid you are interconnecting into,” Wood says. “So, we try to measure all of the details about what is going on at the point of interconnection and then allow the owner-operator to use that information to affect what is going on at their plant to try to optimize it.”
As an example, Wood points to a trend among inverter manufacturers to overextend the capabilities of their systems. This allows a developer to build a 22 MW plant instead of a 20 MW one in order to take advantage of the additional capacities allowed by the rated inverter performance. The inverter capability combined with the relatively low cost of panels essentially enables a 22 MW plant to be built for the same cost as a 20 MW plant. The developer may do this even though they have a contract to provide no more than 20 MW to the grid.
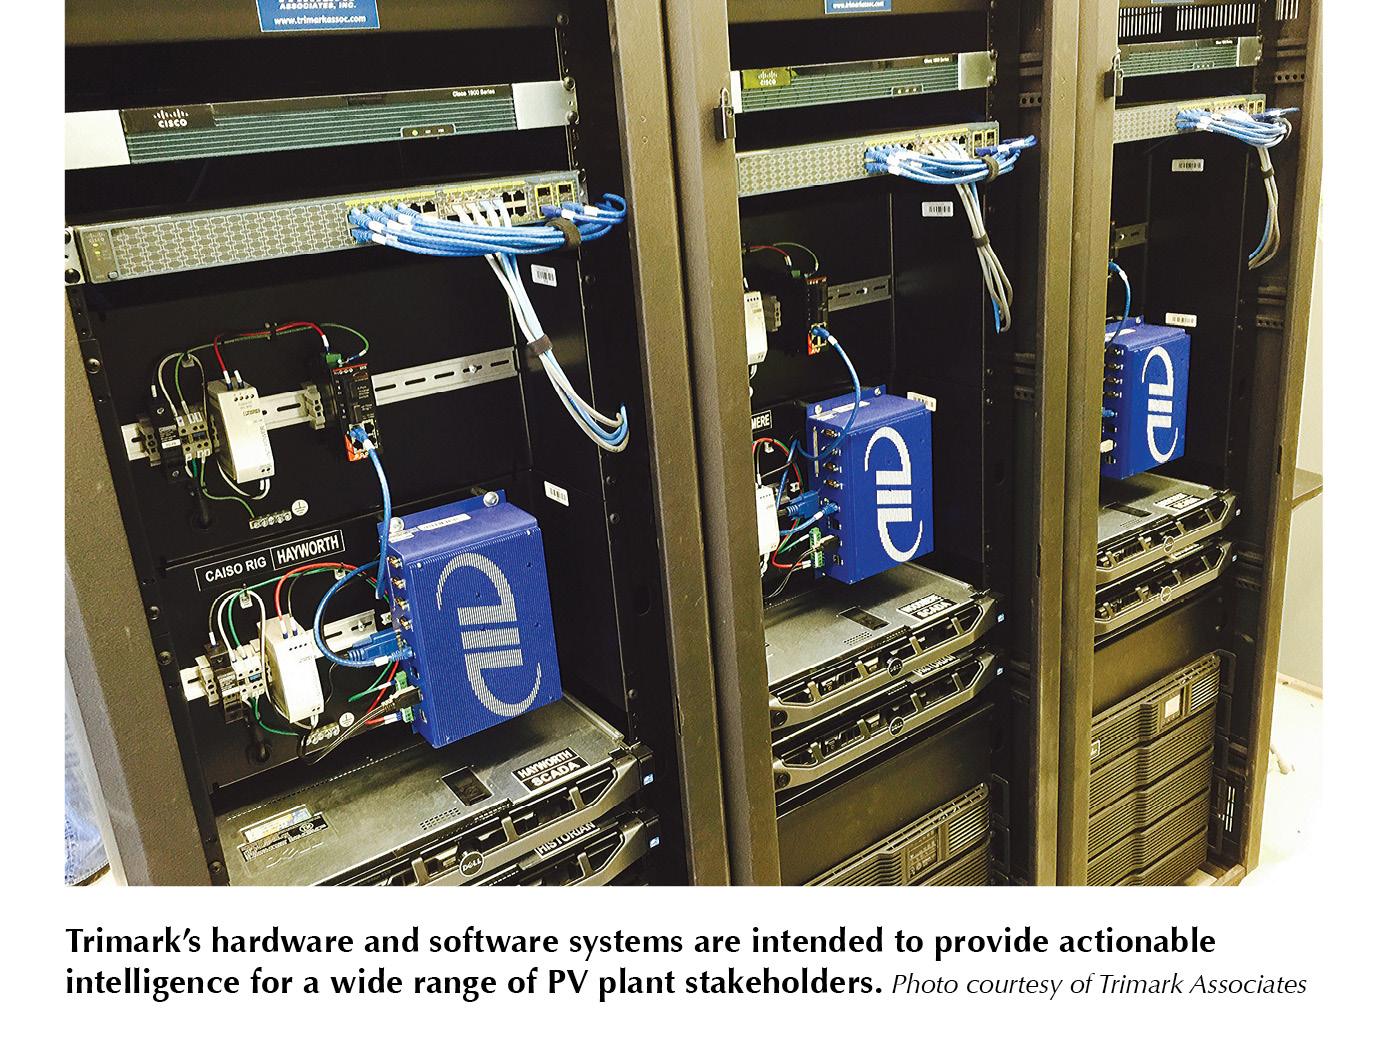
The rationale, Wood says, is that the operator can use a monitoring and control system, such as Trimark’s T1-S, to perform a constant closed-loop curtailment to diminish the effect of variables, such as the cloud-edge effect, which is caused when a cloud passes over a portion of the array and affects one of the inverters but not the others.
“When that inverter dips down, our system can recognize that - and in some cases, predict that - and adjust the other inverters up to make up the difference so that the point of interconnection stays at the 20 MW target, optimizing the production and the revenue,” Wood says. “The monitoring and SCADA systems are being used for intelligence - not just information that humans have to figure out, but intelligent information to help plants reach certain thresholds under specified conditions.”
Monitoring data is also enabling O&M providers to move from a scheduled maintenance regime to one more closely tied with day-to-day performance. Increasingly, Wood says, organizations are not cleaning panels at a regular interval. They are cleaning panels whenever they reach a certain degradation. “I don’t think any of the larger facilities are doing cleanings according to a set schedule,” he says. “They are able to collect information and analyze it for performance thresholds in order to schedule performance-based cleanings.”
Weather information combined with technical monitoring and SCADA data can be combined to develop a more granular knowledge of how a plant is operating and how it is affecting the grid. Such information can be used to inform long-term decisions as well as real-time actions.
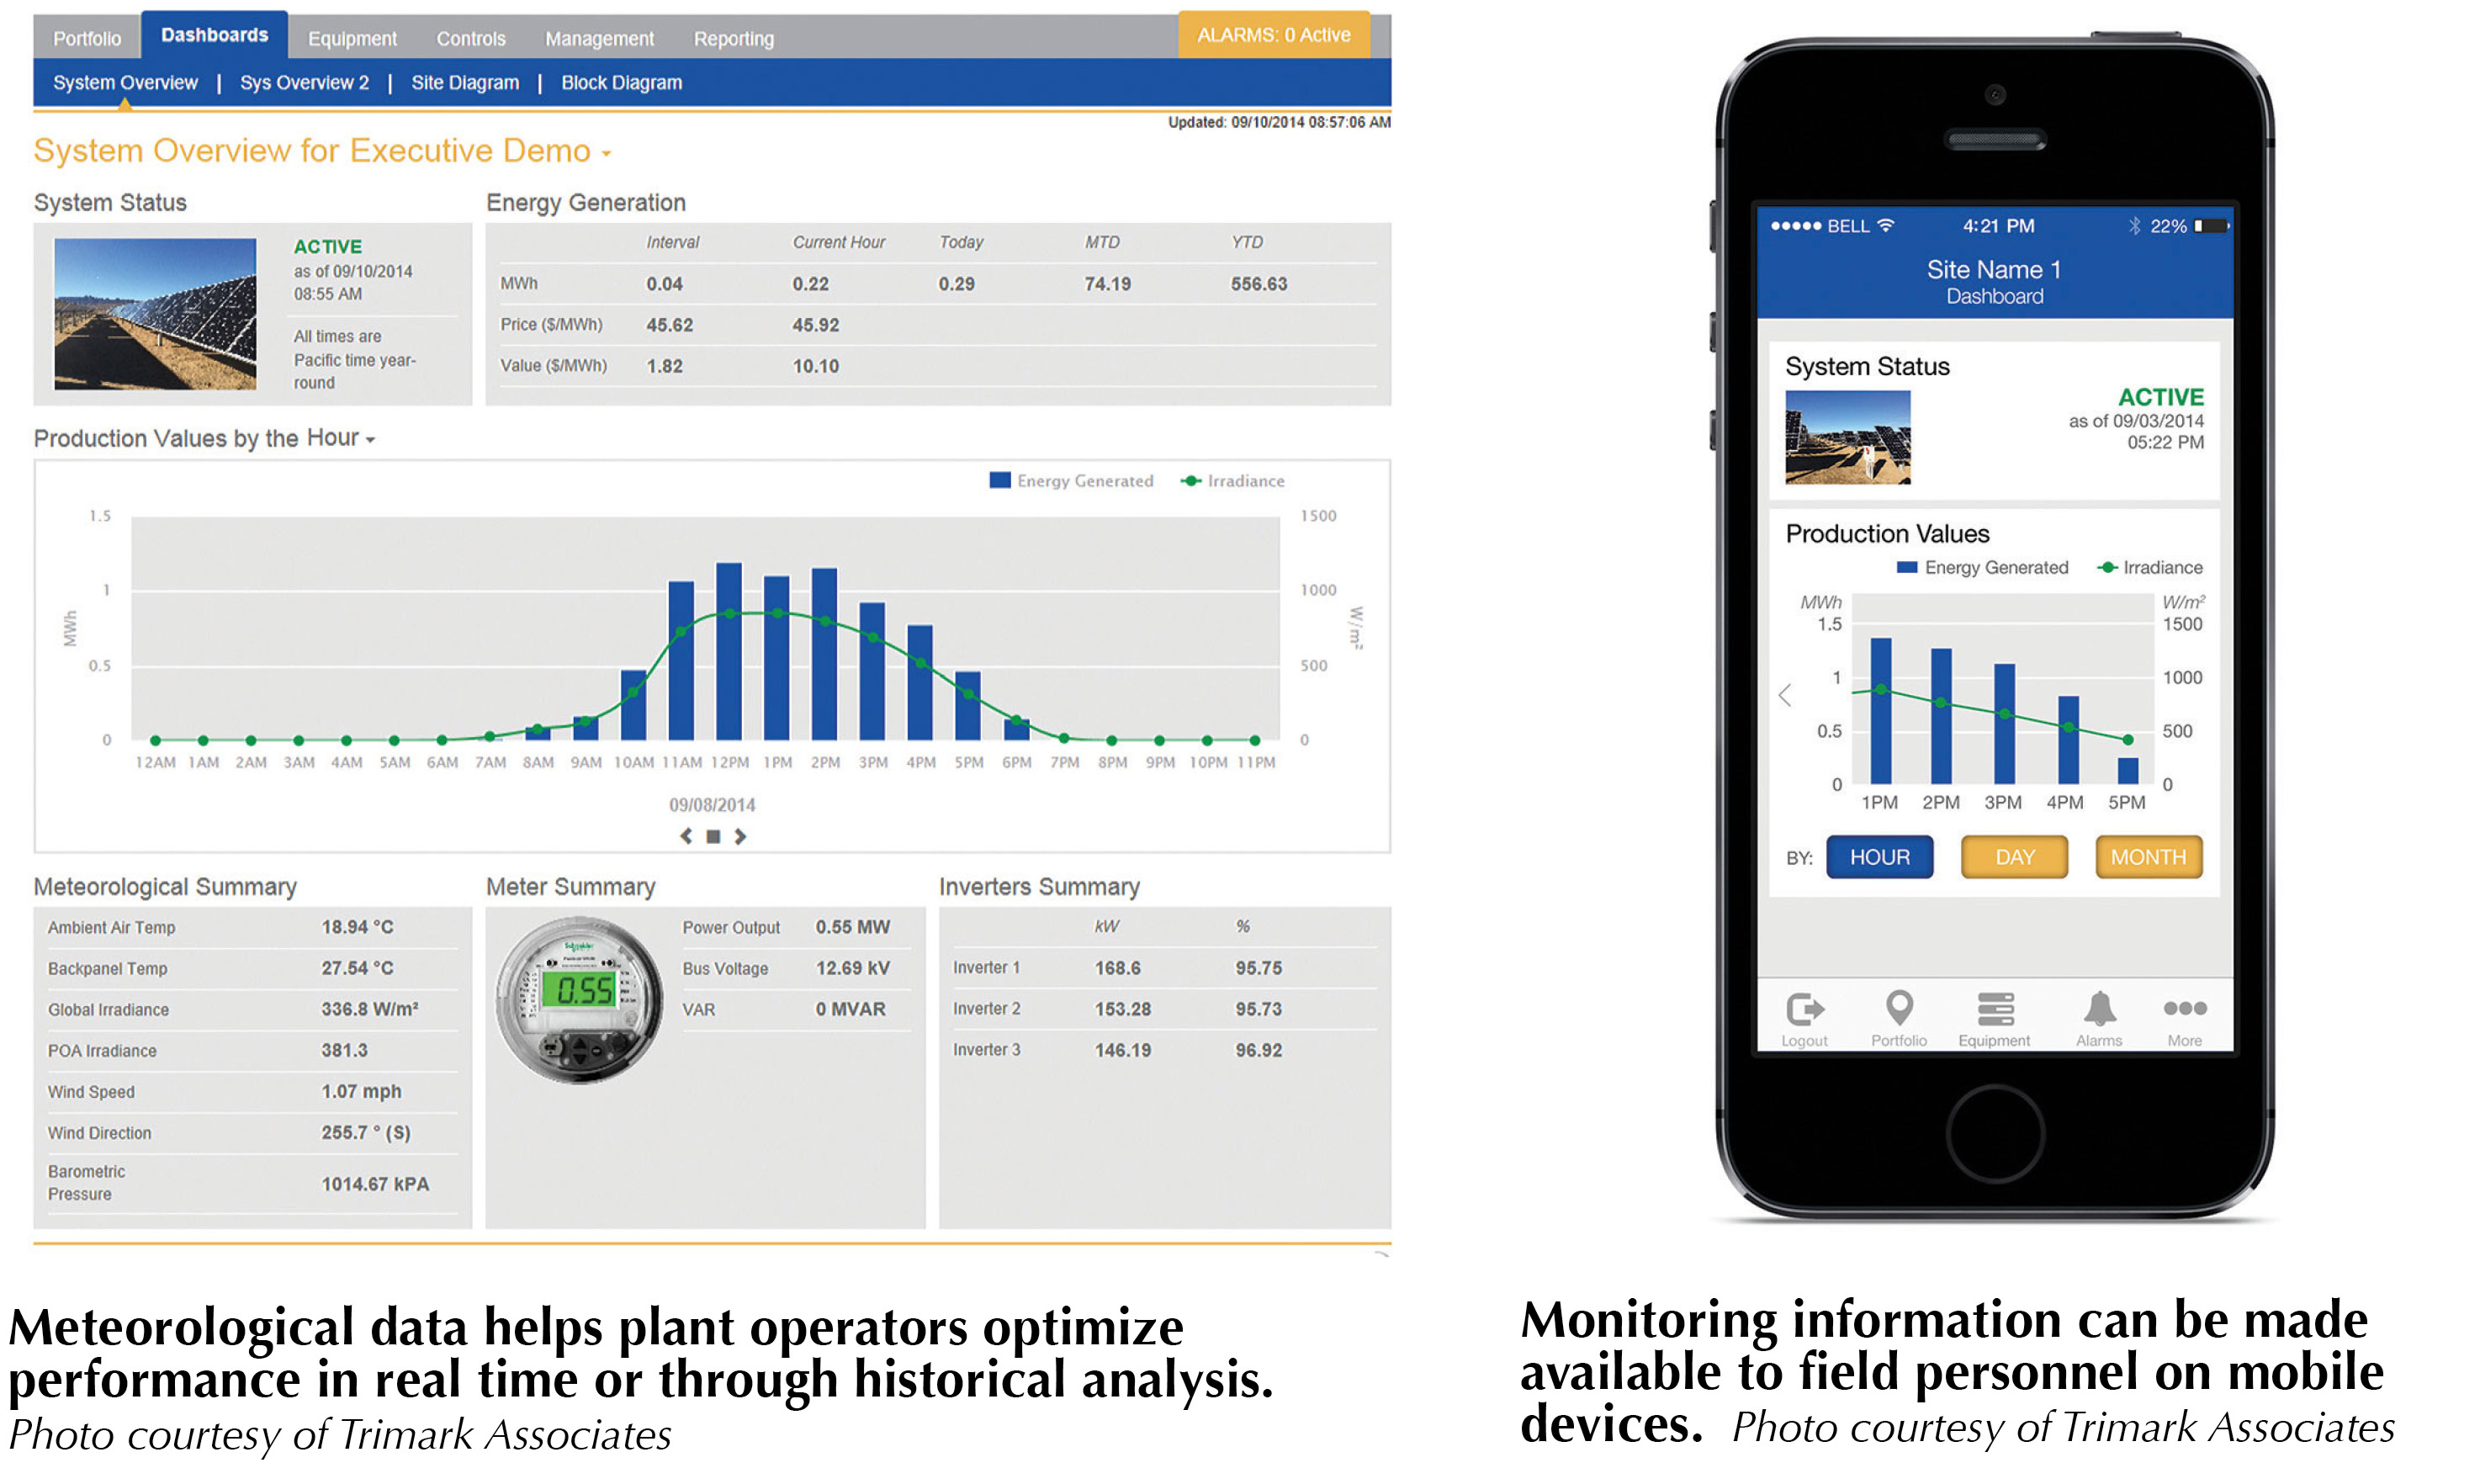
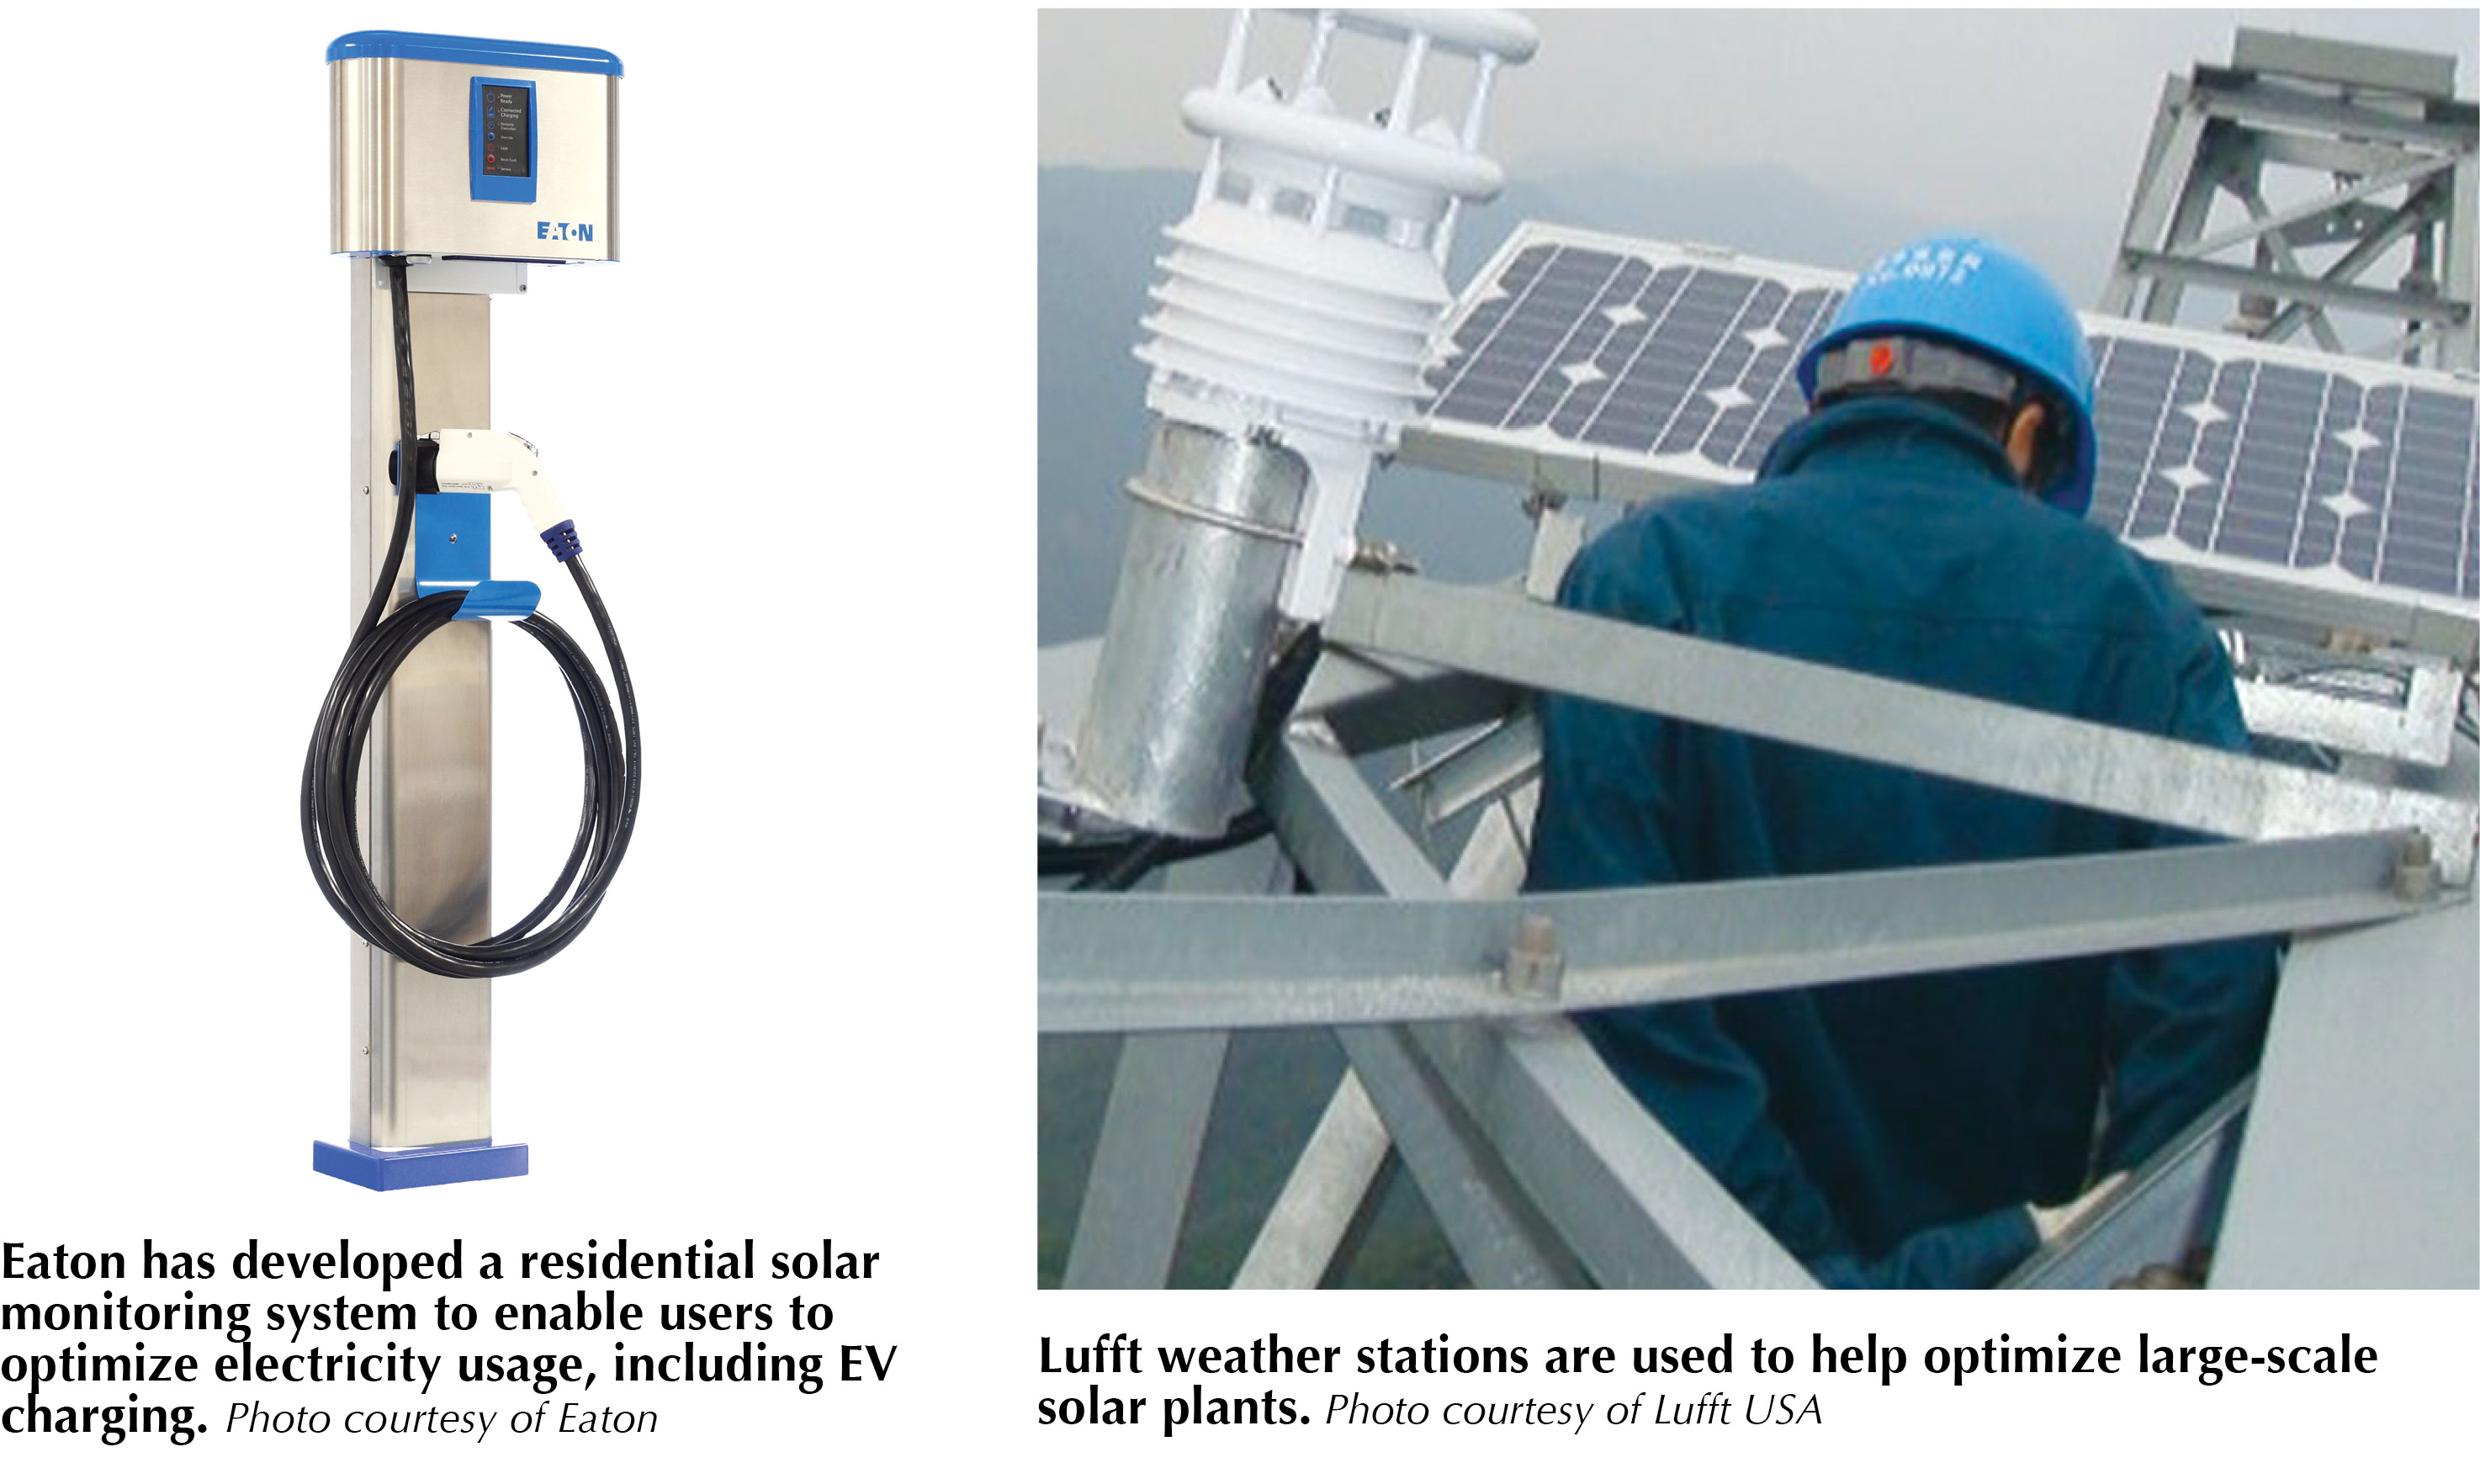
The California Independent System Operator requires all grid-connected solar resources in the state generating more than 1 MW of power to provide at least one meteorological station. Trimark contracted with Lufft USA to supply the two weather stations required for the 265 MW Imperial Valley Solar 1 facility. These measure ambient temperature, wind speed and direction, humidity, barometric temperature, solar irradiance, and back-panel temperature.
Wood says two of the most useful sets of data from facilities so equipped are plane of array irradiance and the back-panel temperatures because those two values convey a lot of information about plant performance. “If you find that you have significantly higher back-panel temperatures in one part of the array, it might mean that the wind isn’t flowing through the array to cool it down as planned,” he says. “It could be degrading and, therefore, generating more heat. The more sensors that are deployed, the more accuracy you can get in your sense of what is going on.”
Such information can also be used in a trending analysis, so if you have a reduction of 1% or 2% in the overall performance over a period of six months, it might be time to schedule preventative maintenance. The O&M crew can walk the strings and check the thermal signatures of the combiner boxes, clean the panels, and so forth. Historically, Wood says, companies are using that information for making determinations on builds nearby. “They have historical weather information on one plant that can be used to determine the viability and financeability of a project a few miles away,” he says.
The maturity of operations and ownership of plants is evident across the board. With this experience comes increasing demand for information about PV plant performance in order to make decisions that will improve plant performance today and 20 years from now. S
System Monitoring
PV Monitoring Systems Provide Actionable Intelligence
By Michael Puttré
Across the board, stakeholders - from field service personnel to asset managers - are turning to advanced analytics to help improve plant performance.
si body si body i si body bi si body b
si depbio
- si bullets
si sh
si subhead
pullquote
si first graph
si sh no rule
si last graph