
301 Moved Permanently
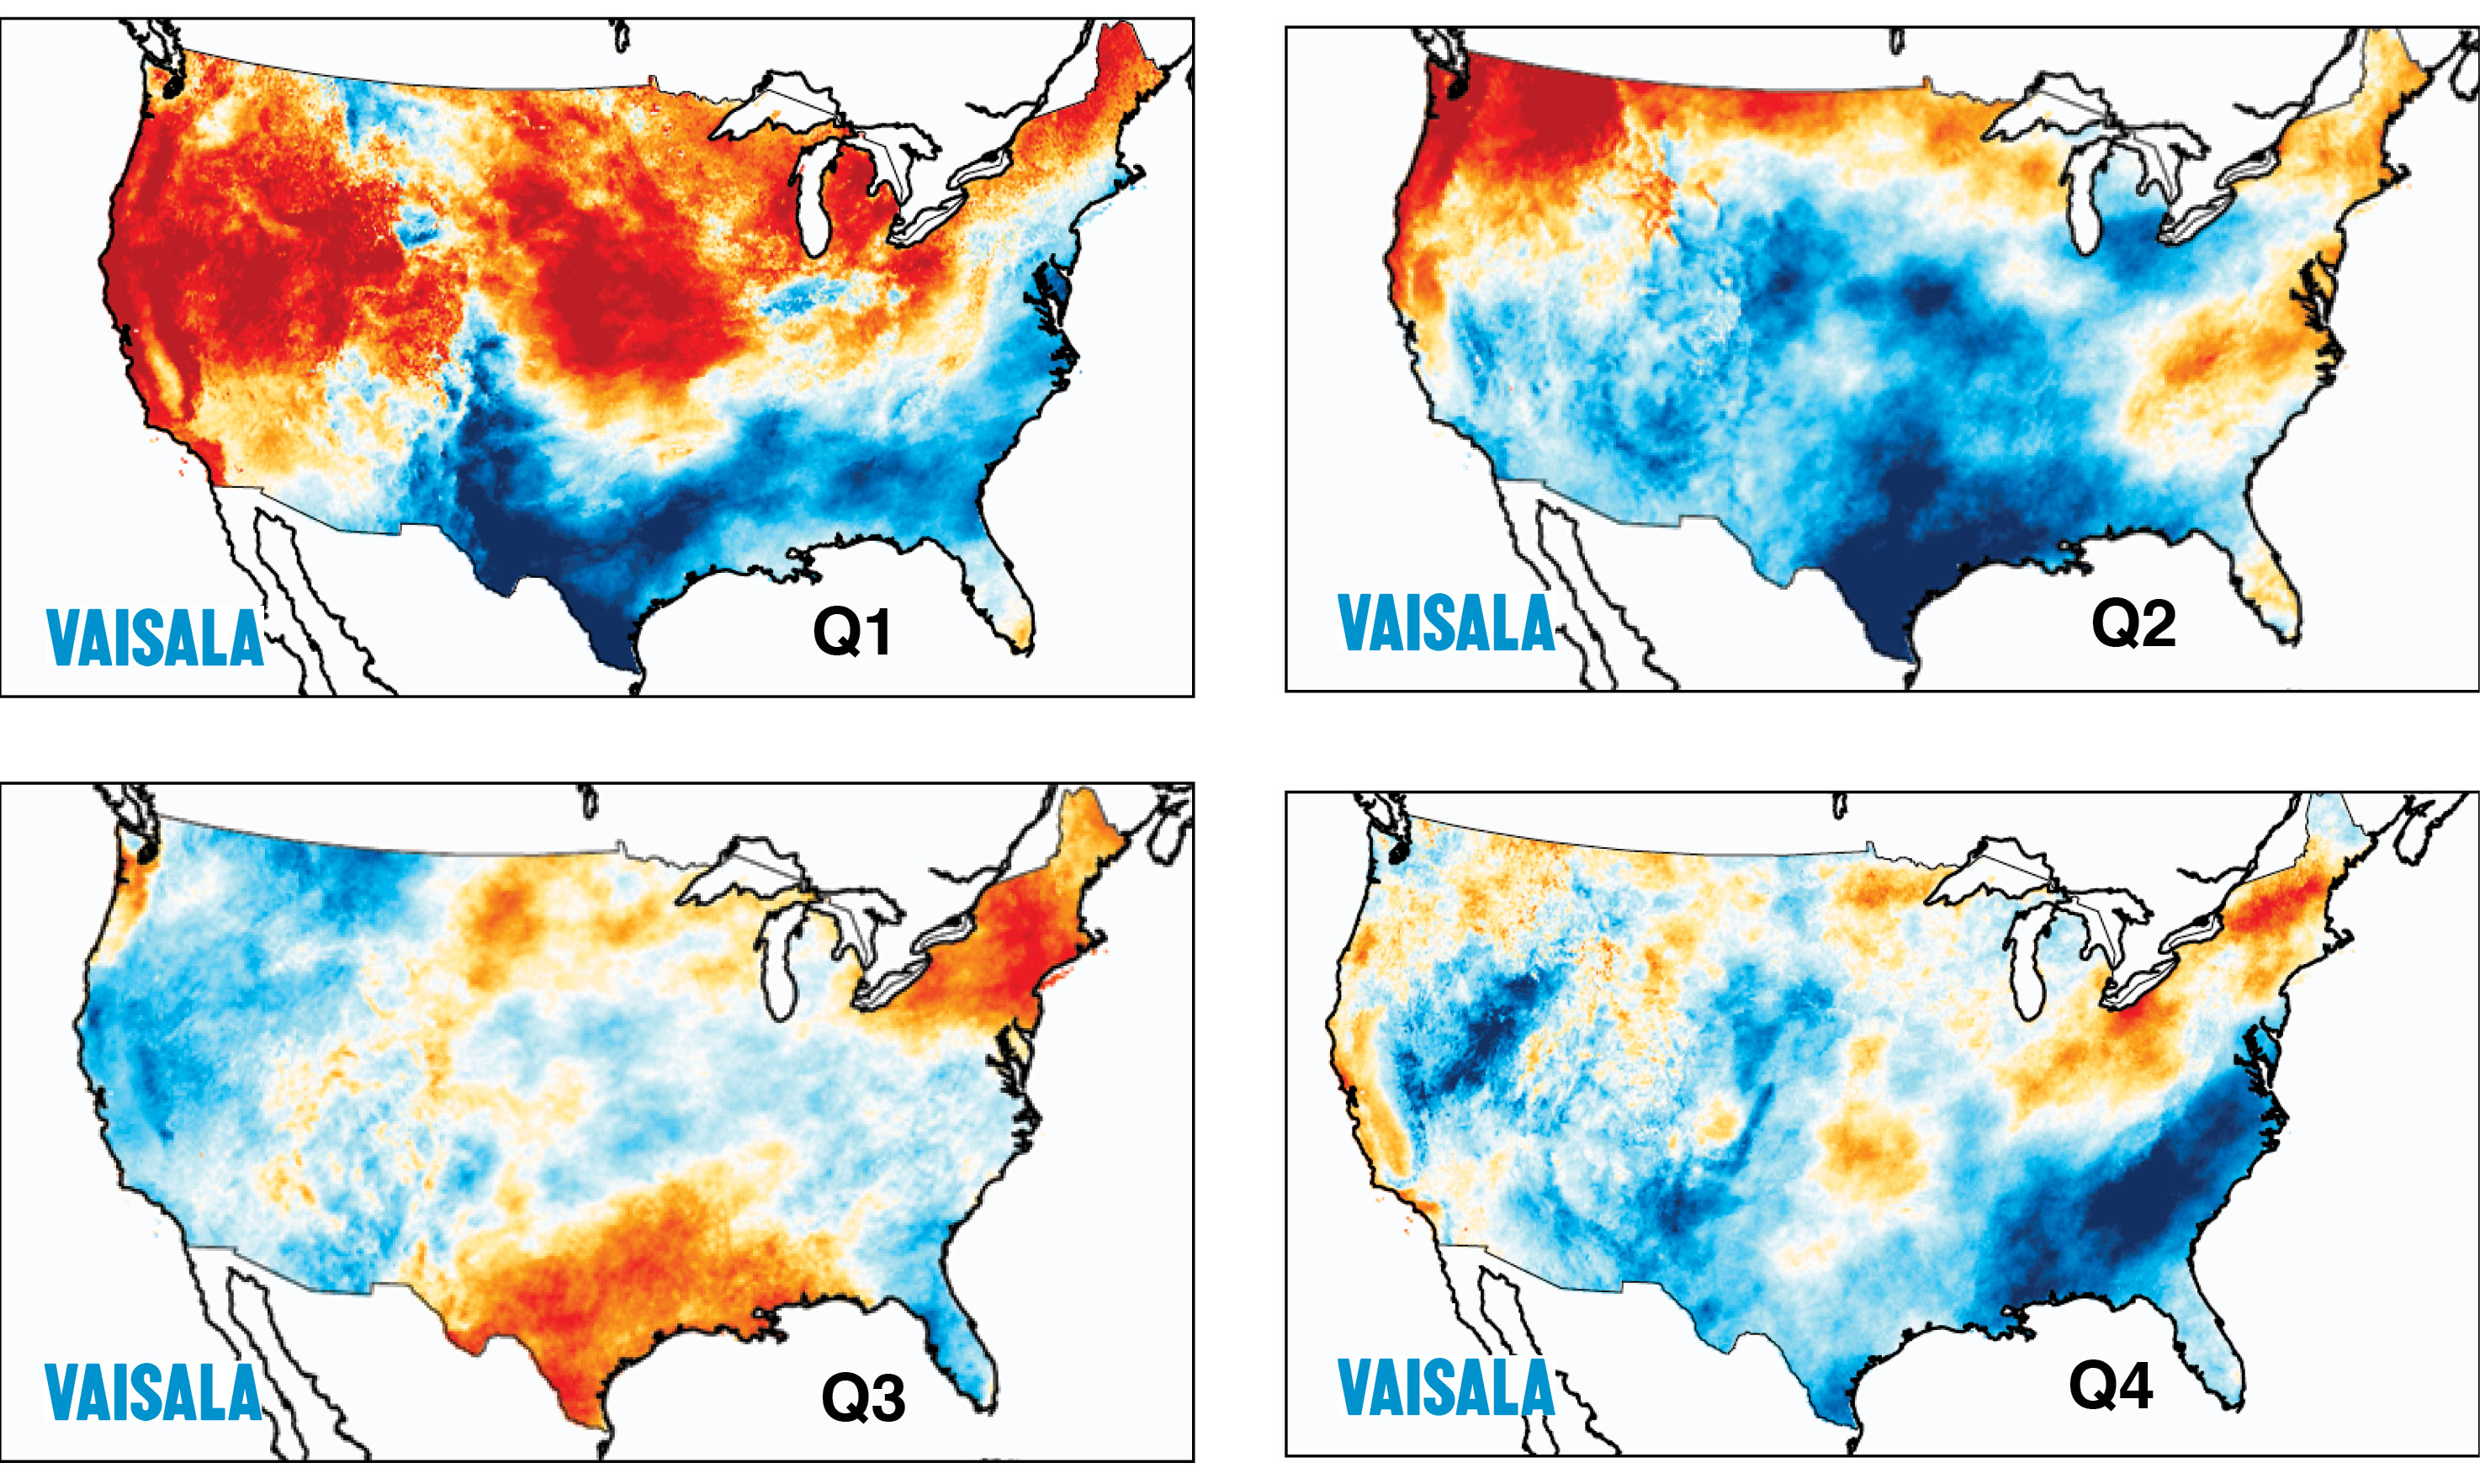
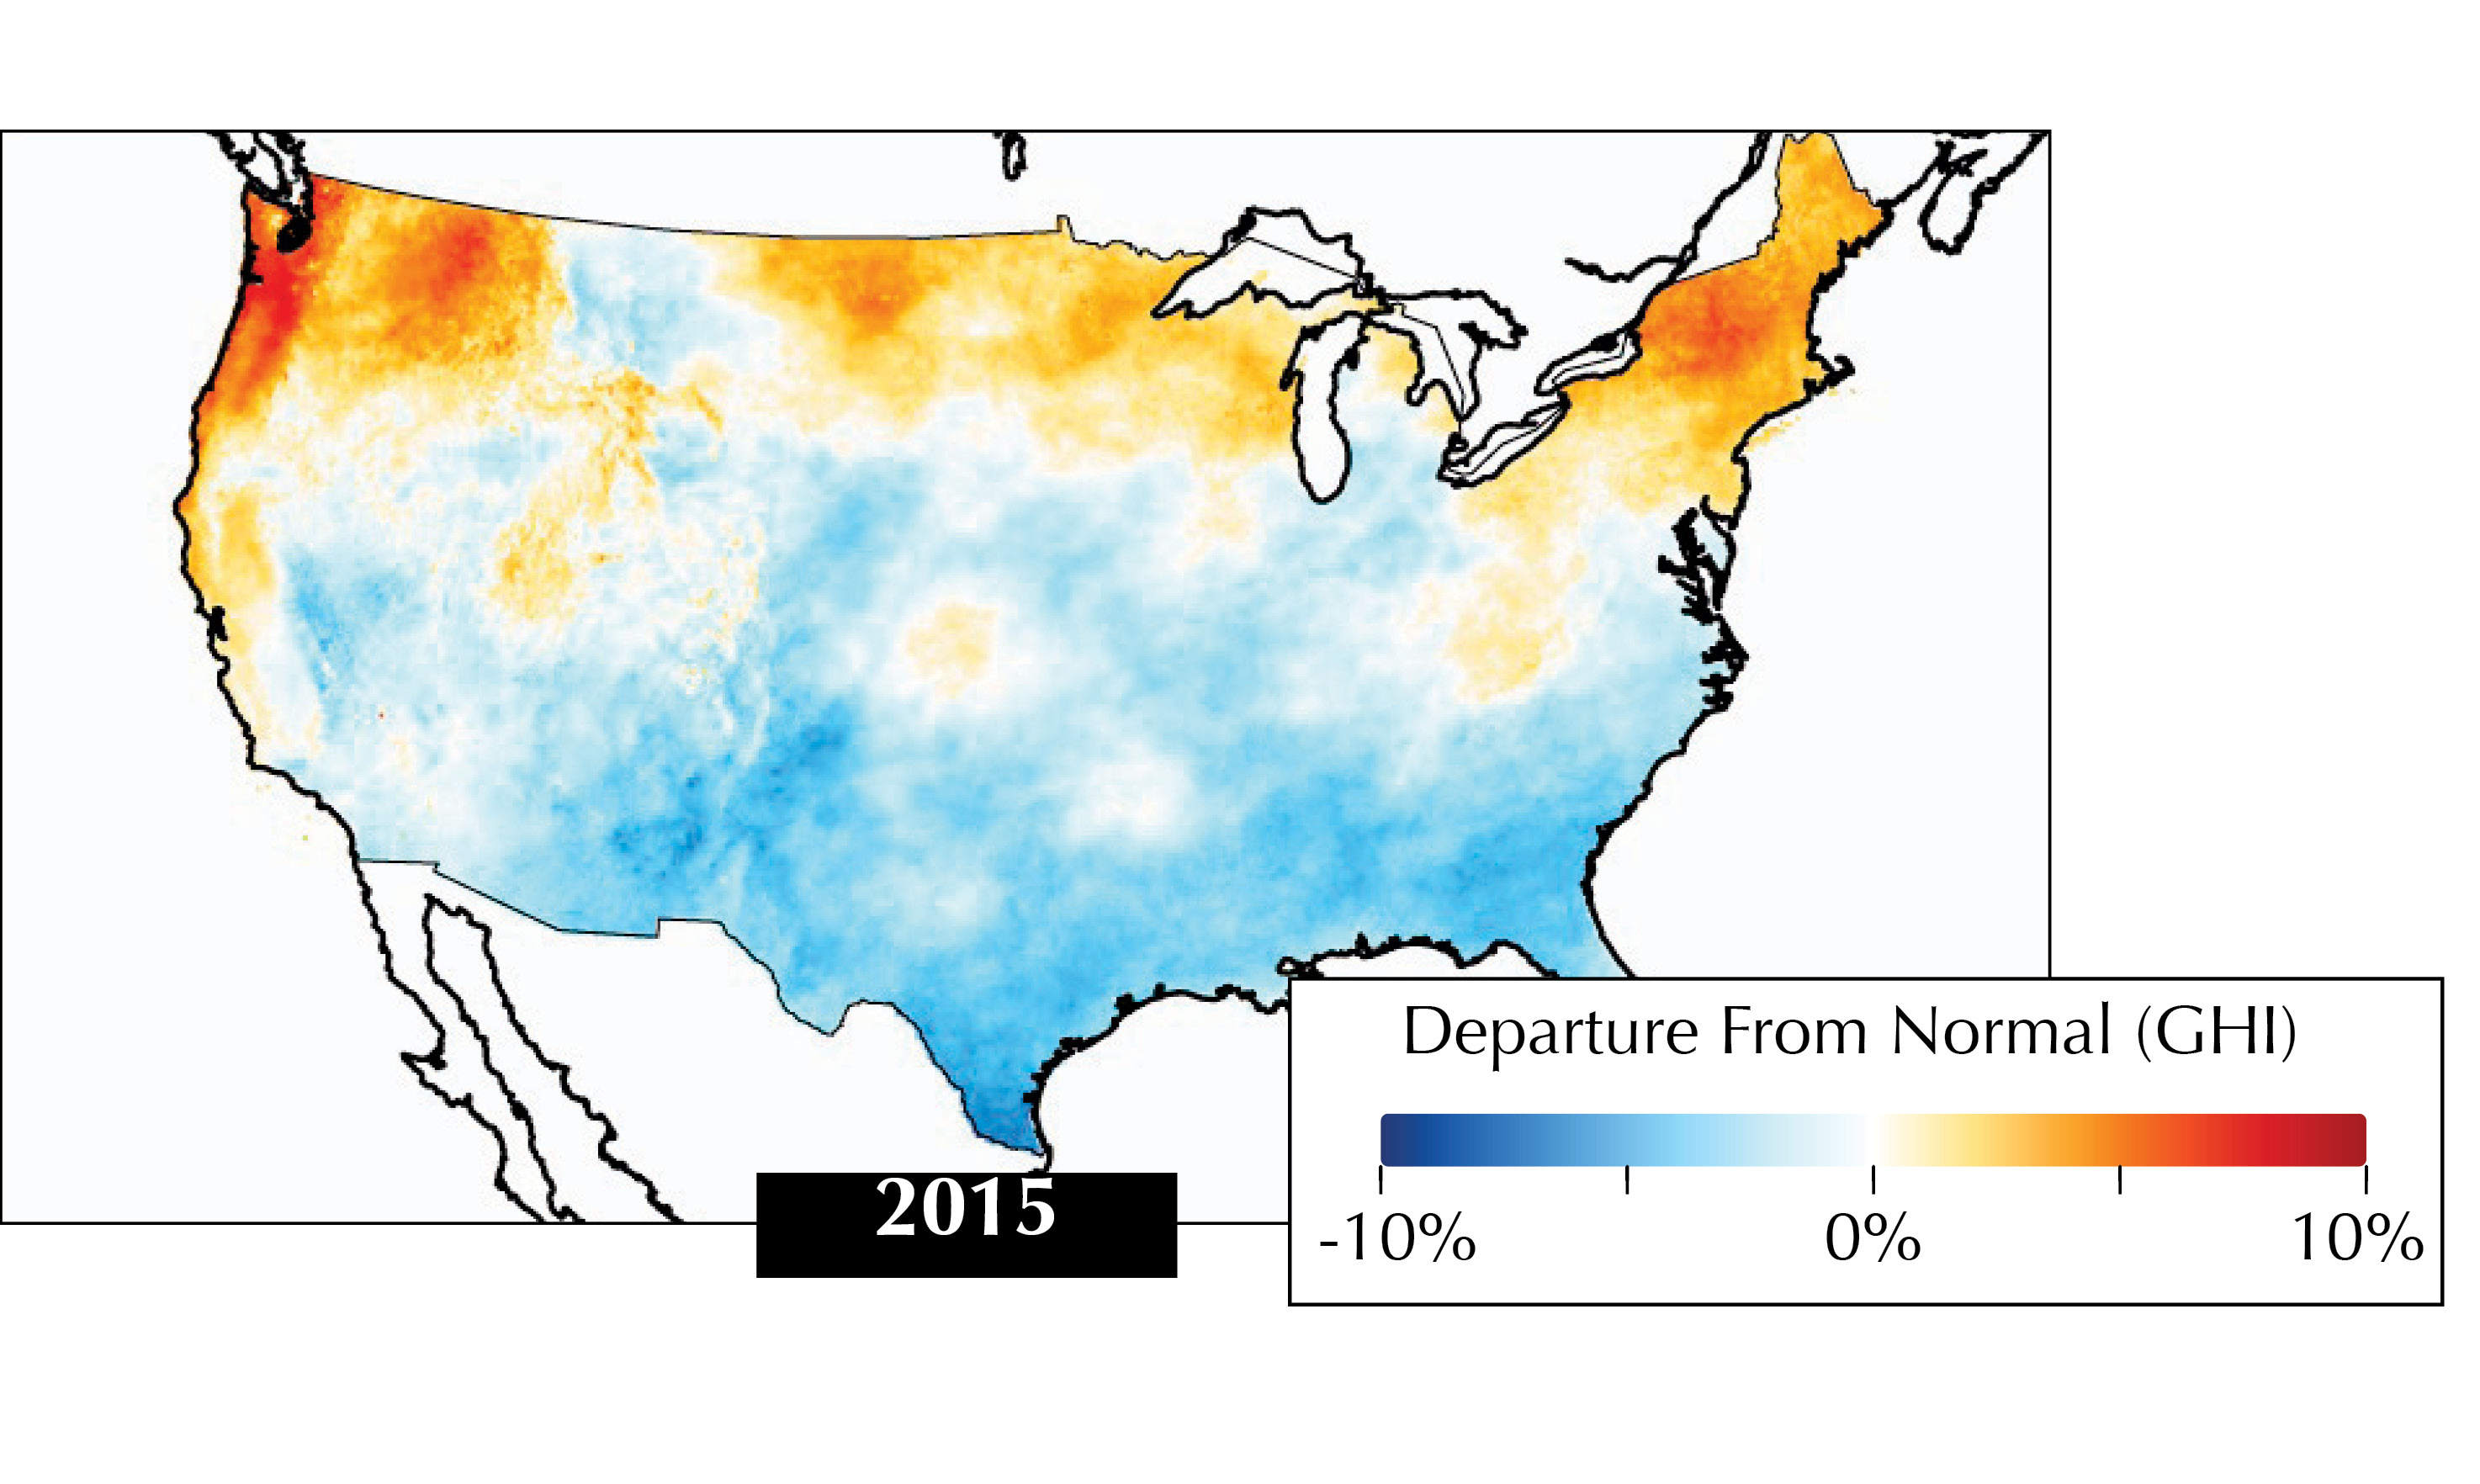
2015 was a wetter-than-normal year across much of the U.S., which was beneficial for states struggling with drought, but not necessarily for the solar industry. Recent solar performance analysis reveals that solar irradiance levels were 5% below long-term averages across the southern U.S. The corresponding impact was felt most notably during the first two quarters when emerging solar markets, such as Texas, saw irradiance levels more than 10% below normal.
This was the result of much cloudier and rainier conditions than normal in the region due to high storm activity and the onset of a strong El Niño in the final months of the year. In three of the four quarters, high levels of moisture brought from the Gulf of Mexico arrived in southern states, with many receiving 20 inches of rain or more in the second quarter. Texas was particularly hard hit, suffering severe flooding and experiencing its wettest 12 months on record from January to December.
Over 300 MW of new solar projects were scheduled to come online in Texas last year, and a 2 GW construction boom is anticipated in the coming years as the solar sector looks to emulate the success of the region’s wind industry. Unfortunately, many operational solar sites in the region had unexpected poor production in 2015, given that many operators and asset managers still do not account for the production impact of weather deviations from long-term conditions when monitoring performance. The situation creates a difficult starting point for an industry trying to get off the ground in a new region.
Weather data
Although solar irradiance is much less variable than wind, it is no stranger to anomalous deviations, such as those seen in 2015. These frequent and significant departures from the long-term average have a direct impact on project performance. For example, a 2% reduction in solar resource generally equals a 2% reduction in power produced.
Challenging weather events, such as those experienced in Texas last year, highlight the clear need to analyze the effect of solar resource variability on power output to weather-adjust project performance. In these cases, knowing when solar conditions are above or below normal avoids a great deal of wasted time and operational budget trying to correct potential equipment problems that simply do not exist but are, instead, due to a lack of resource.
Accounting for weather conditions with on-site measurements or a regular weather data feed is the vital first step in assessing whether a solar plant is performing as expected. On-site measurements are fairly standard practice at larger utility-scale plants, which usually perform a more rigorous pre-construction site assessment using well-maintained weather stations and long-term time series of hourly conditions. Although considered “ground truth” and the best source of site conditions, pyranometer accuracy is highly dependent on the type of equipment and how well it is maintained. Additionally, unfavorable weather conditions, such as heavy snow or hail, can impact measurement equipment performance. For this reason, having an independent data feed helps validate or substitute on-site irradiance measurements.
Although the challenges are different for smaller plants, understanding performance is equally important, particularly because they often come online without a benchmark of long-term irradiance variability. Rooftop installations commonly rely on averaged conditions for pre-construction modeling and resource assessment. However, in many cases, these assets are ultimately owned and operated by large leasing companies, which must maximize the value of their generation portfolios while minimizing maintenance costs the same way a utility-scale project does.
Because rooftop sites are operated remotely, owners have limited context on local conditions. When power suddenly dips, they cannot step outside to see if the weather changed or if there is a system problem. Also, the scale of rooftop installations makes deploying a ground crew or measurement equipment at every location prohibitively expensive. When power goes down at a specific location, it is still critical to understand why. Was it just a cloudy day, or is there a system problem?
To do this, companies use a range of monitoring software and devices to track vast amounts of real-time information at the panel and inverter level, particularly with respect to power production. Yet, a key piece of information missing from the data stream is local irradiance conditions - the actual source of the power. Without it, understanding if a project underperformed because of weather or an equipment issue is a daily guessing game.
Recent weather and forecast data feeds also support cost-effective snow removal decisions in solar-dense regions like the northeastern U.S. that face wintertime operational headaches due to heavy snow and ice. For example, this information helps decide whether it is worth the $2,500 snow removal fee to clear panels at a 2.5 MW system to generate $3,100 worth of power on a sunny day in February if more snow is coming or forecasted rain may clear panels naturally.
Effective solar asset management
With nearly 26 GW of installed solar capacity in the U.S., operations and maintenance (O&M) can no longer be treated as an afterthought. It is not enough for a system to generate energy; it must maximize performance for a stronger overall portfolio. Without professionally managed systems and strong O&M practices, it is almost guaranteed that solar assets are underperforming. Fortunately, there are only two pieces of information required to solve this problem: how the equipment is performing and what the weather is doing.
The first has many solutions in hardware and software that are dedicated to the task. With increasing sophistication in system monitoring hardware, we are getting more visibility on tracing problems, from micro-inverters in small systems and revenue-grade meters at the inverter level at utility-scale plants, in addition to the traditional plant-wide monitoring systems. There has also been an explosion in software platforms over the last two years for interpreting the increasing amount of data coming from a plant and translating it into actionable alerts.
Weather data can come from a variety of sources with varying quality and price tags. The industry standard would be a satellite-derived solar irradiance dataset. However, just as important as data quality is availability. Does your information source offer data coverage across your entire existing and potential project network? Can the source guarantee data will be available on a reliable basis 365 days a year? If you are making operational decisions based on this information, you will want to make sure it is consistent across all of your sites to make apples-to-apples comparisons and that it is always available when you need it. To ensure the information is best leveraged, you’ll also want to consider ease of integration with your existing performance monitoring platform.
Beyond these two essential inputs, another critical dataset for many asset management activities would be utility data for the plant. Depending on the country and the utility, this data can be hard to obtain, and in certain markets, third-party providers are offering these datasets in an “easily digestible format” for a fee.
Detailed field information is often overlooked as an operational input, but technicians on the ground are usually closest to actual operations and frequently have important observations. Their insights may allow operators to safeguard or improve the long-term performance of the plant long before monitoring systems signal a problem.
With so many different data inputs, what kind of data should you collect? How granular should it be? What are the key time intervals? Finally, how long should you hold on to all of this information? Data storage is cheap, but not if you are storing unusable information you don’t know what to do with.
The safe bet is to keep everything to avoid losing something that may prove beneficial in the future. However, a more informed and practical approach would be to examine the use cases for performance data we know of today, which include the following:
Performance analytics: The most cited use case for plant data is analytics for performance enhancement. If you can separate production impacts from weather versus production impacts from equipment, you can reconcile recent performance and identify and fix performance issues. You can also avoid wasted time chasing down equipment problems that don’t exist. To complete this analysis, at minimum, you need access to concurrent power meter information and weather inputs.
Performance reforecasting: An increasingly important use case for plant data is the evaluation of a plant by a potential buyer or for bank refinancing. Investors and financial institutions may send in a technical advisor to assess the health of the plant. This is no longer only a check mark on due diligence lists; it directly affects transaction value or refinancing conditions.
Financial forecasting: Cuts or changes in feed-in tariffs in some countries have created a need for owners and operators to perform detailed liquidity analyses and assess if they will be able to meet debt service during low-irradiation months. For this use case, it is more relevant to look at the actual historical performance of the plant, rather than at the theoretical P50 forecast data.
Regulatory compliance: Regulators require storage of specific datasets to prove compliance with national and federal energy regulations. Operators need to track revenue loss and potential compensation for lost output events, such as curtailment instructions by the energy buyer or transmission operator. These lost output events will need to be documented in detail and stored for a considerable period.
Plant enhancements: Solar assets may, at some stage, be repowered as part of a microgrid or have storage added to them. In these cases, detailed historical performance data will be critical for making sound engineering and financial decisions.
Data management best practices
Once the key use cases for your portfolio are identified, the next step is to ensure that the datasets are actually usable. Analytics will be relatively meaningless if the underlying data can’t be trusted because information is missing or incorrect. To ensure that data is of sufficient quality, here are a few best practices for operators to follow:
Validate data: Data quality will be significantly improved with a data validation process comparing inputs from two similar datasets, such as inverter data against utility meter data, with automated algorithms or manual validations. The process must be auditable so that if some data is altered, approximated or backfilled, the organization has a record of the change, who made it, when and why.
Fill data gaps: If data is missing, incomplete or corrupted, the asset manager should attempt to create an alternate dataset as a proxy and be sure to flag it as such.
Keep consistent records: Detailed record keeping for alarms, alerts and events is important. Beyond events tracked by the monitoring system, this should also include a log of external events, such as grid outages, curtailments and other events with a direct or indirect impact on performance.
Maintain field records: Record keeping for field observations and interventions is critical but often harder than it sounds. Many owners are struggling with incomplete records because they switched O&M service providers or their O&M providers went out of business. These records may be lost or were never kept in a professional manner.
Integrate data into one platform: A great best practice is to “free” the respective datasets from their silos. Often, monitoring data lives in one or more monitoring platforms, while weather data resides in weather portals. Meanwhile, events and work orders live in computerized maintenance management systems, spreadsheets or email correspondence, and the utility data lives on a utility portal, a spreadsheet or even just a piece of paper. Performing meaningful analytics or data validation requires easy data access. This will involve standardizing, normalizing and storing the datasets in a centralized data warehouse.
Tracking all of these data points and following best practices may seem like a lot of effort at first sight, but consider for a moment being a new plant manager for a Texas project. When having to explain what happened last year, aren’t you better positioned if you can show in detail the causes of underperformance case-by-case? The future benefits of proactive monitoring are quite significant.
So, be practical. The requirements at every site are going to vary in terms of the information you need to gather for making different decisions. Knowing this, begin with the end in mind. What are the most important decisions you need to make now or foresee making in the future? After a close evaluation of top priorities, determine the performance monitoring information and platform that will best address your core obstacles and concerns.
System Performance
Weather Data And Performance Monitoring
By Gwendalyn Bender
Project underperformance in the southern U.S. underscored a need to address monitoring and account for weather variability.

si body si body i si body bi si body b
si depbio
- si bullets
si sh
si subhead
pullquote
si first graph
si sh no rule
si last graph
