As solar energy development continues to expand in the Southeast – increasing almost 30-fold over the last five years – the growth patterns remain varied depending on specific location, according to a new report from the Southern Alliance for Clean Energy (SACE).
The Solar in the Southeast 2017 Annual Reporthighlights solar data and trends throughout the region – Alabama, Georgia, Florida, Mississippi, North Carolina, South Carolina and Tennessee – and identifies both “leaders and laggards,” according to SACE.
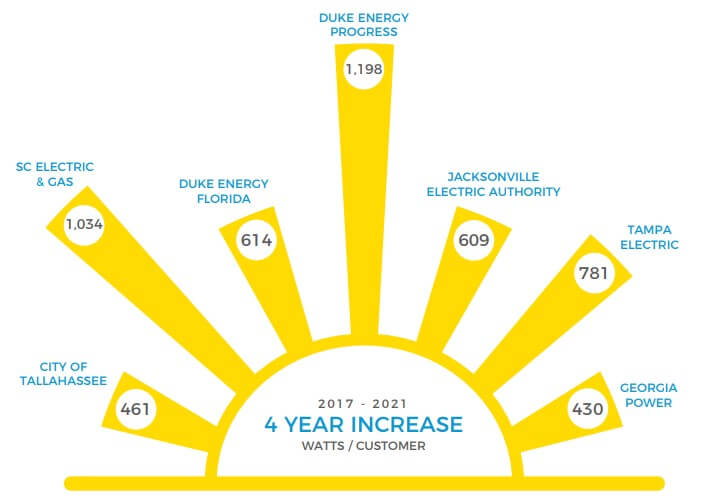
Using the metric “watts-per-customer,” which looks at the amount of installed solar relative to the total number of customers served, the report offers information at the regional, state and utility level. According to SACE, the watts-per-customer metric provides an unbiased standard by which utilities and states can be compared and contrasted.
SunRisers
Duke Energy Progress, Duke Energy Carolinas and Georgia Power are the region’s current solar leaders based on the 2017 watts-per-customer ranking.
Looking forward, the report calls out seven utilities with the highest forecasted solar growth by 2021. Duke Energy Progress and Georgia Power both make this list, as well, along with South Carolina Electric and Gas, Tampa Electric, Duke Energy Florida, Jacksonville Electric Authority, and the City of Tallahassee.
These utilities each serve more than 100,000 customers and are noted in the report as “SunRisers” due to their ambitious levels of planned solar growth, says SACE.
SunBlockers
In contrast to the “SunRisers,” the report also identifies three major utility systems – Tennessee Valley Authority (TVA), Santee Cooper and Seminole Electric Cooperative – as laggards, or “SunBlockers,” which steadfastly stick with outdated plans for low levels of solar development over the next four years, SACE claims. For example, the “monopolistic behavior” of TVA is restricting solar choice across the Tennessee Valley, the alliance says.
According to the report, TVA was an early leader in small-scale, distributed solar. However, TVA, failing to respond to customer demand for solar, is aggressively using a self-regulated rate design process to undercut customer-owned distributed solar throughout the valley, says SACE. Additionally, the utility’s current integrated resource plan, which calls for 150 MW-800 MW of large-scale solar by 2023, represents a very low solar target for a utility of TVA’s scale, adds SACE. Forecast at just 125 watts-per-customer by 2021, TVA’s management commitment to solar is well below the Southeast average, the report notes.
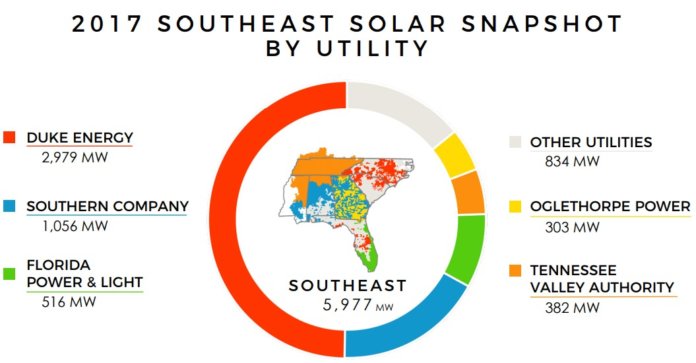
Despite being the second-largest utility in the Southeast and serving 16% of customer accounts, TVA represented just 6% of total solar capacity in the Southeast in 2017, the report adds.
“Looking at the low performance path that TVA is currently on, coupled with their current rate change process that further undercuts solar development in their service territory, it is clear that TVA will need a serious course correction to avoid being in last place in the region,” states Dr. Stephen A. Smith, executive director of SACE.
Policy Focus
Leading states like North Carolina, South Carolina and Georgia have enacted strong policies that foster and encourage renewable energy growth, the report says. On the other hand, utilities in other Southeastern states – particularly Tennessee, Alabama and Mississippi – continue to operate in a public policy vacuum, SACE claims. The slow pace of solar growth in these states – and the outdated thinking by utilities – leaves them with solar projections considerably below the regional average through 2021, according to the report.
North Carolina has enjoyed a favorable policy environment and, with 3 GW, currently has the most solar PV capacity in the Southeast and second-most in the U.S. Furthermore, Duke Energy Progress and Duke Energy Carolinas combined to contribute 83% of North Carolina’s solar in 2017. In addition, Duke Energy Progress will more than double its watts-per-customer ratio by 2021. North Carolina’s recent energy law (H.B.589) is contributing to that continued growth, the report notes.
Florida
Due to its strong net-metering rule, Florida has been a strong regional leader in residential solar for the past five years and has seen the rooftop market further accelerate following two ballot initiatives in 2016, says the report. However, the state’s rooftop market is still vulnerable as some utilities are beginning to revise their net-metering approach, says SACE.
SACE is now forecasting more than 735 MW of distributed solar in Florida by 2021. The state continues to close the gap in utility-scale solar, as well, with a current path to 4 GW of total solar (including both rooftop and utility-scale) by 2021 due to major announcements of utility-scale solar development in 2017 from Florida Power & Light, Duke Energy Florida, Tampa Electric Co. and JEA. However, when these announcements are analyzed using the watts-per-customer metric, Florida Power & Light will be below the regional utility average by 2021, and the state as a whole will remain below the Southeast state average, according to SACE.
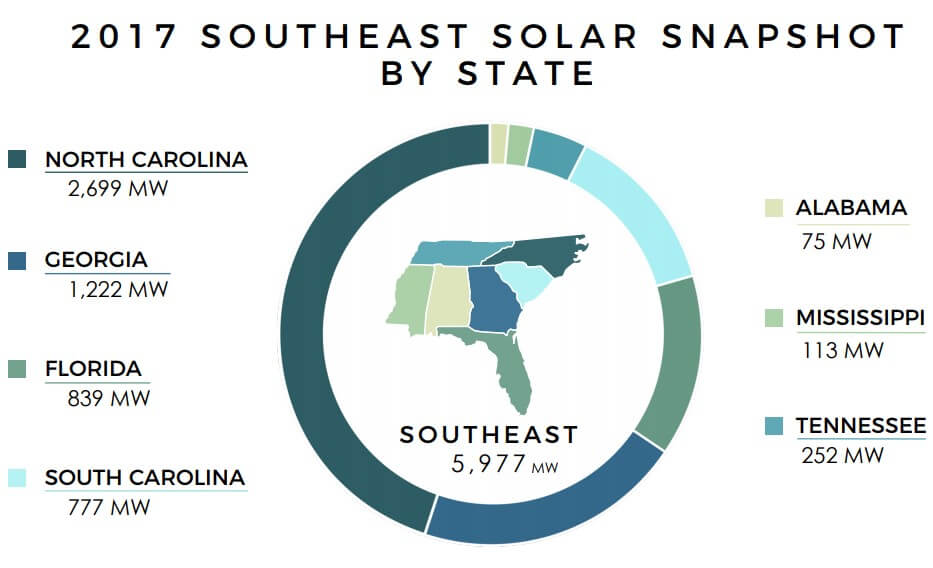
“This analysis demonstrates the enormous potential that remains in the Southeast for increased solar development while also shining a light on those utilities who are poised to fall behind in the coming years,” adds Smith. “Using the unbiased watts-per-customer metric, we are able to see which states and utilities are on track to continue bringing affordable solar to their customers and which will need a serious course correction to avoid being in last place. It is our hope that this data will be used to make informed planning decisions by utilities and regulators across the board.”

