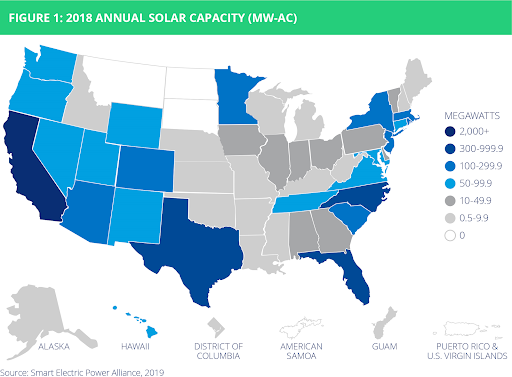
A new report from the Smart Electric Power Alliance (SEPA) shows that the solar industry saw a geographical expansion beyond the traditional powerhouse markets – e.g., California and North Carolina – in 2018.
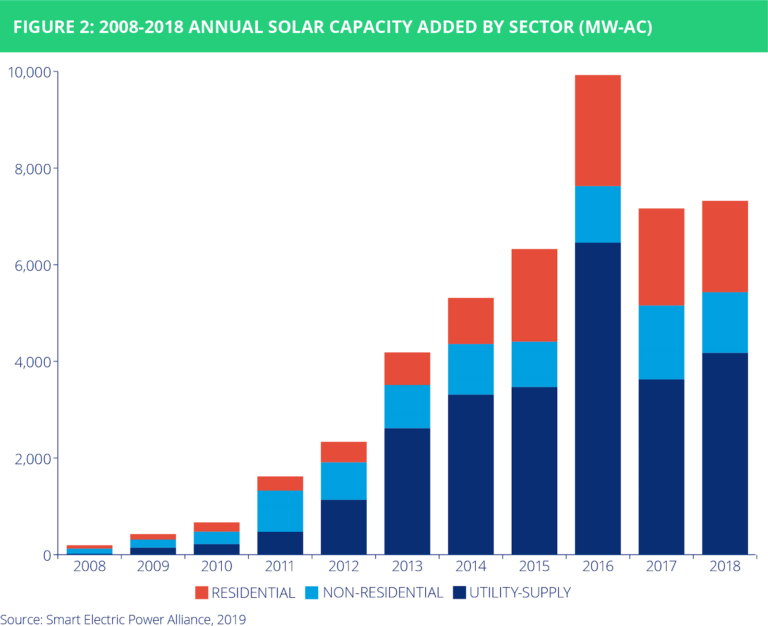
According to SEPA’s 2019 Utility Solar Market Snapshot, there was 7.3 GW of solar interconnected in 2018, marking a 20.1% increase in total capacity over 2017. Now in its 12th year, the Utility Solar Market Snapshot is based on interconnection data and market insights obtained directly from more than 500 utilities across the country.
The solar snapshot shows that the national market remains strong and competitive – despite minor cost impacts from the solar panel and steel tariffs of 2018, says SEPA. Particularly, emerging markets such as Florida, Washington and Rhode Island saw huge year-over-year growth rates of 311.9%, 150.2% and 344.1%, respectively. Other strong emerging markets included Texas, Minnesota, South Carolina and Oregon.

SEPA also recognized the top 10 U.S. utilities that interconnected the most new solar capacity in their service territories. Pacific Gas and Electric (PG&E) maintained the No. 1 spot with 630 MW interconnected, while Florida Power & Light was second with 626.8 MW, and Southern California Edison ranked third with 440.7 MW. Rounding out the top five were Duke Energy Progress in North Carolina with 436.3 MW and Northern States Power Minnesota (Xcel) with 269.4 MW.
Reedy Creek Improvement District – the municipal district serving and powering Walt Disney World in Florida – took the No. 1 spot when it came to the top utilities for annual watts-per-customer, with 35,936.4 W/C. Texas-based Georgetown Utility Systems and Ohio-based Village Electric Utility-Brewster ranked second and third, respectively. Third and fourth, respectively, were Dominion Energy North Carolina and the Bolivar Energy Authority in partnership with Tennessee Valley Authority.
The report notes that 2018 was the largest year for corporate renewable procurements, with 75 companies procuring a total of 6.5 GW, compared to 50 companies and 4.5 GW added in 2016 and 2017 combined.
Overall, the utility-supply solar market experienced 15.1% growth nationally, says SEPA.

“Driven by the increasingly competitive economics and capabilities of solar, paired with rising consumer demand, the 2019 SEPA Utility Solar Market Snapshot highlights the industry’s decade-long pattern of growth and expansion to new markets,” comments Mac Keller, co-lead author of the report and research associate at SEPA. “The utilities in this year’s top 10 solar rankings are among those spearheading the latest progress we’ve seen in the electric sector and paving the way to a clean, smart and resilient energy future.”
SEPA’s full report can be downloaded here.


