The U.S.’ utility-scale solar PV market saw 11.2 GW of new projects announced in the first half of 2019, bringing the utility PV pipeline to a historic high of 37.9 GW, according to the latest U.S. Solar Market Insight Report from Wood Mackenzie and the Solar Energy Industries Association (SEIA).
This contracted pipeline of 37.9 GW is the highest in the history of U.S. utility solar photovoltaics, the report says. In the second quarter alone, 6.2 GW was contracted.
In addition to the utility solar pipeline growth, residential solar deployment rebounded from the same period last year.
“It’s no surprise that the U.S. solar pipeline is surging as costs continue to fall and solar becomes the lowest cost option for utilities, corporations and families,” says Abigail Ross Hopper, president and CEO of SEIA. “However, as we push for solar to represent 20 percent of U.S. electricity generation by 2030, smart policies, like an extension of the solar investment tax credit, will be critical to reach this goal.”
According to the report, several utilities have announced large solar procurements, and corporate off-takers, such as Starbucks, Microsoft and Anheuser-Busch, have also made major announcements. In fact, off-site corporate solar procurement represents 17% of the new utility-scale solar capacity announced in 2019.
“As more companies commit to 100 percent renewable power, corporate off-site procurement is expected to drive more than 20 percent of new utility-scale capacity additions from 2019 through 2024,” says Colin Smith, senior solar analyst with Wood Mackenzie. “Cities, states and utilities are already following through on their renewable energy and zero-carbon commitments. We’re starting to see procurement occur and expect even more RPS-driven procurement in the near- to mid-term.”
The report authors say that 55% of the utility-scale projects announced in 2019 were the result of solar’s economic competitiveness with other generation sources. Utility-scale solar prices are at their lowest point ever, with recent power purchase agreements signed for $18-$35 per megawatt-hour.
In Q2, 1 GW of utility-scale PV came online in the U.S., representing nearly half of the total 2.1 GW installed in the quarter. However, year over year, the 2.1 GW of installed solar represented a 7% decline from Q2 2018.
The residential segment, helped by emerging state markets, saw both quarterly growth of 3% and annual growth of 8% in the quarter. Further, Q2 2019 was the fourth consecutive quarter of more than 600 MW of installed residential capacity.
Meanwhile, the non-residential segment, comprising commercial, industrial, nonprofit and community solar installations, experienced both quarterly and annual declines due to policy transitions and persistent interconnection issues in key markets, the report points out. Specifically, non-residential PV saw 426 MW installed – a decline from Q1 – as policy shifts in states such as California, Massachusetts and Minnesota continued to impact growth.
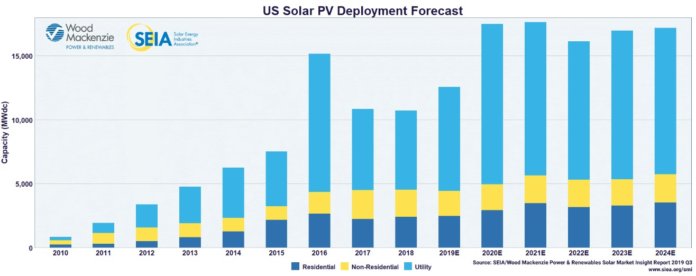
Going forward, the report forecasts 17% year-over-year solar growth in 2019, with 12.6 GW of installations expected. In total, more than 6 GW has been added to the report’s five-year forecast since last quarter to account for new utility-scale procurement.
Further, total installed U.S. PV capacity is expected to more than double over the next five years, with annual installations reaching 17.6 GW in 2021 prior to the expiration of the federal investment tax credit for residential systems and a drop in the commercial tax credit to 10% for projects not yet under construction.


