
The utility-scale solar sector has led the overall U.S. solar market in terms of installed capacity since 2012. In 2016, the utility-scale sector installed more than 2.5 times as much new capacity as did the residential and commercial sectors combined, and it is expected to maintain its dominant position for at least another five years, according to a new report from the Lawrence Berkeley National Laboratory.
Berkeley Lab says its “Utility-Scale Solar 2016” report – the fifth edition in an ongoing annual series – presents analysis of empirical project-level data from the U.S. fleet of ground-mounted solar projects with capacities exceeding 5 MW-AC. While focused on key developments in 2016, the report explores trends in deployment and project design, installed project prices, operating costs, capacity factors, and power purchase agreement (PPA) prices among both utility-scale photovoltaic (PV) and concentrating solar thermal power (CSP) projects throughout the U.S.
According to Berkeley Lab, highlights from this year’s edition include the following:
Installation Trends: The use of solar tracking devices dominated 2016 installations, at nearly 80% of all new capacity. In a reflection of the ongoing geographic expansion of the market beyond California and the Southwest, the median long-term average insolation level at newly built project sites declined again in 2016. While new fixed-tilt projects are now seen predominantly in less-sunny regions, tracking projects are increasingly pushing into these same regions. The median inverter loading ratio has stabilized in 2016 at 1.3 for both tracking and fixed-tilt projects.
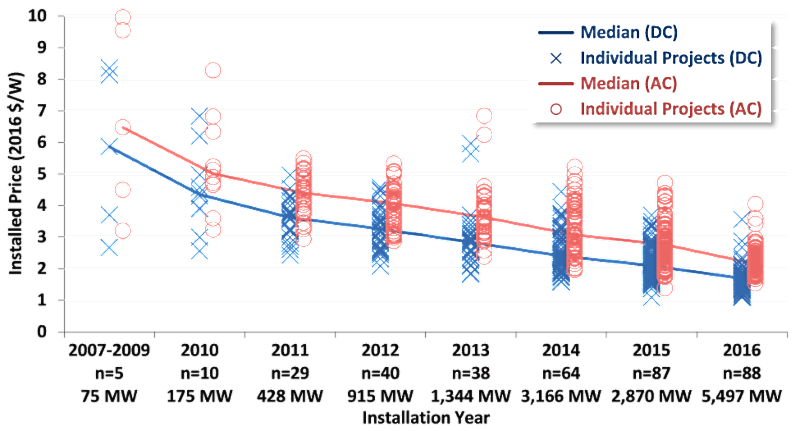
Installed Prices: Median installed PV project prices within a sizable sample have fallen by two-thirds since the 2007-2009 period, to $2.2/W-AC (or $1.7/W-DC) for projects completed in 2016. The lowest 20th percentile of projects within the researchers’ 2016 sample were priced at or below $2.0/W-AC, with the lowest-priced projects around $1.5/W-AC. Overall price dispersion across the entire sample and across geographic regions decreased significantly in 2016.
Operation and Maintenance (O&M) Costs: The report says that what limited empirical O&M cost data are publicly available suggest that PV O&M costs were in the neighborhood of $18/kW-AC-year, or $8/MWh, in 2016. These numbers include only those costs incurred to directly operate and maintain the generating plant.
Capacity Factors: The cumulative net AC capacity factors of individual PV projects range widely, from 15.4% to 35.5%, with a sample median of 26.3%. This project-level variation is based on a number of factors, including the strength of the solar resource at the project site, whether the array is mounted at a fixed-tilt or on a tracking mechanism, the inverter loading ratio, degradation, and curtailment. Changes in at least the first three of these factors drove mean capacity factors higher from 2010- to 2013-vintage projects, where they’ve remained fairly steady among both 2014- and 2015-vintage projects as an ongoing increase in the prevalence of tracking has been offset by a build-out of lower resource sites. Meanwhile, several of the newer CSP projects in the U.S. are struggling to match long-term performance expectations.
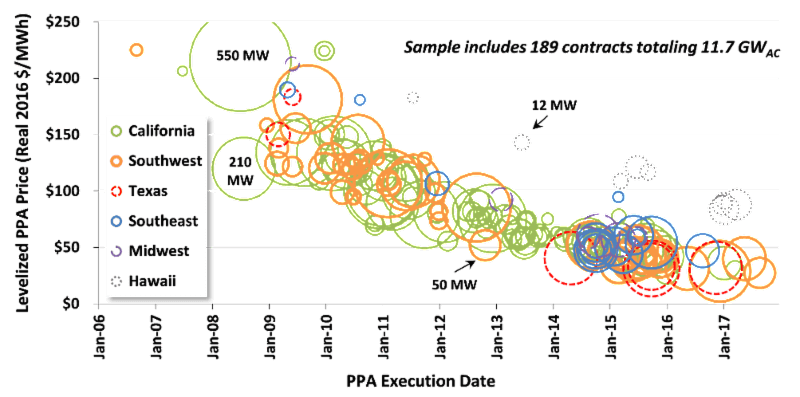
PPA Prices: Driven by lower installed project prices and improving capacity factors, levelized PPA prices for utility-scale PV have fallen dramatically over time. Most recent PPAs in the researchers’ sample are priced at or below $50/MWh levelized, with a few priced as aggressively as ~$30/MWh. Though impressive in pace and scale, the report notes, these falling PPA prices have been offset to some degree by declining wholesale market value within high penetration markets like California, where in 2016 a megawatt-hour of solar generation was worth just 83% of a megawatt-hour of flat, round-the-clock generation.
At the end of 2016, there were at least 121.4 GW of utility-scale solar power capacity within the interconnection queues across the nation, according to the report. The growth within these queues is widely distributed across all regions of the country: California and the Southeast each account for 23% of the 83.3 GW of solar that first entered the queues in 2016, followed by the Northeast (17%), the Southwest (16%), the Central region (12%), Texas (6%) and the Northwest (3%). The report says the widening geographic distribution of solar projects is a clear sign that the utility-scale market is maturing and expanding outside of its traditional high-insolation comfort zones.
The full report is available here, and a related webinar will be held on October 11 at 10:00 a.m. PT. Registration for the free webinar is available here.


