Raptor Maps, a Boston-based provider of aerial thermography software, has released a report outlining factors affecting solar production. The company leveraged its data repository of digital photovoltaic systems to query nearly 2,900 MW across 18 countries to help system owners and operators benchmark and improve their portfolios.
The study encompassed 13 million modules across 300 PV systems and showed that, on average, 1.7% of production is affected in some way. Classifications included in the study include equipment (e.g., inverter, combiner and tracker), environmental (e.g., shadowing and soiling), and module-level findings (e.g., cracking, delamination and activated bypass diodes).
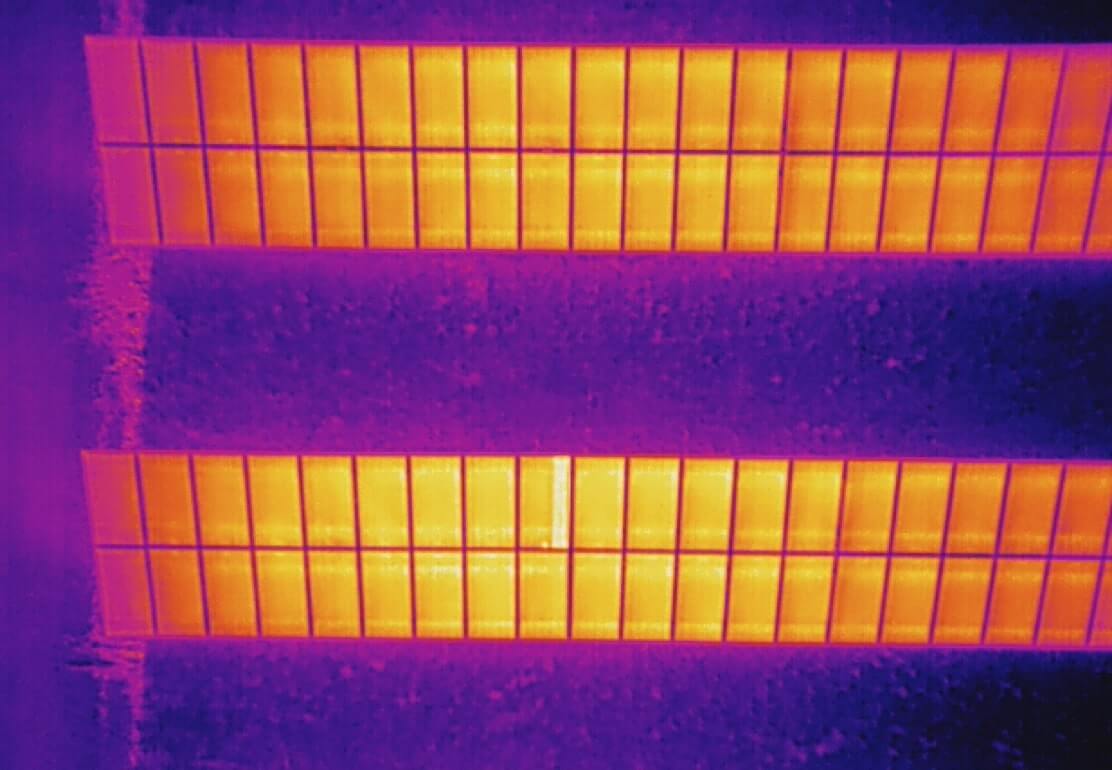
Raptor Maps – which was founded by MIT engineers and is backed by Y Combinator – explains that aerial thermography is the practice of assessing and monitoring PV system conditions using data captured via an aircraft equipped with a thermal camera. The technique is increasingly required by asset owners and financiers for performance verification and risk mitigation.
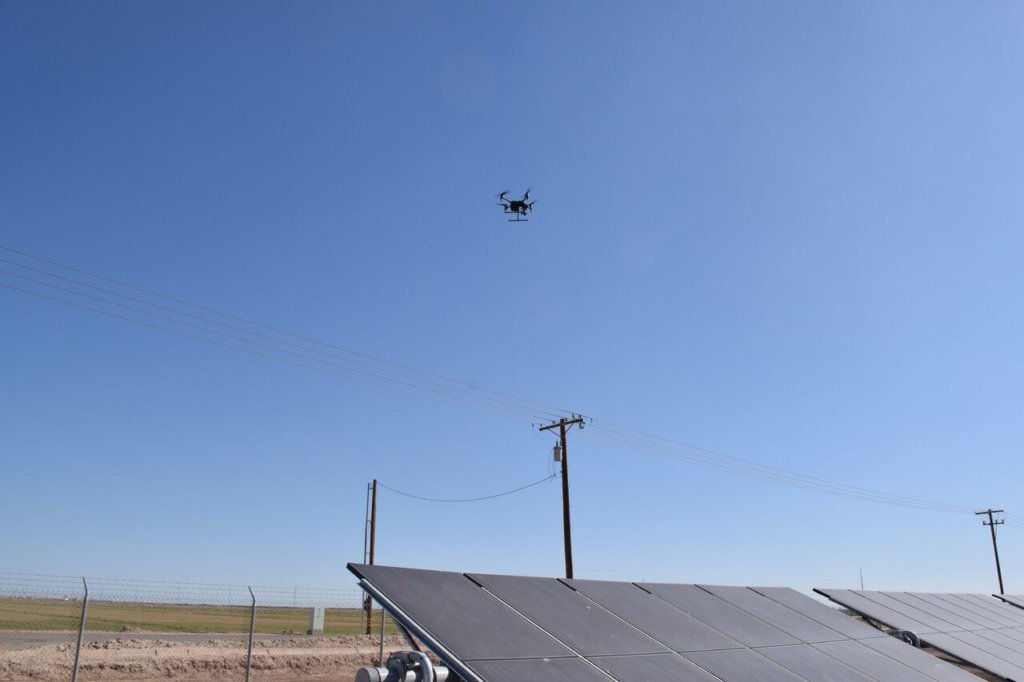
For this study, the company used small unmanned aircraft systems, or drones, operated by parties including asset owners, asset managers, operations and maintenance providers, independent engineers, and drone service providers. The flights occurred from January through December 2018.
Thermal image resolution ranged from a ground sample distance of 15 centimeters per pixel for rapid, high-level inspection, to 3 centimeters per pixel. The level of detail was most often specified by the asset owner, says Raptor Maps.
This study encompassed a total of 12,945,747 modules across 292 PV systems with a total nominal capacity of 2,882 MW. Sites ranged from 10 kW to 300 MW across 18 countries and six continents. In total, 276,954 modules contained findings (2.1% of total analyzed), with an affected power of 50.27 MW (1.7% of total analyzed).
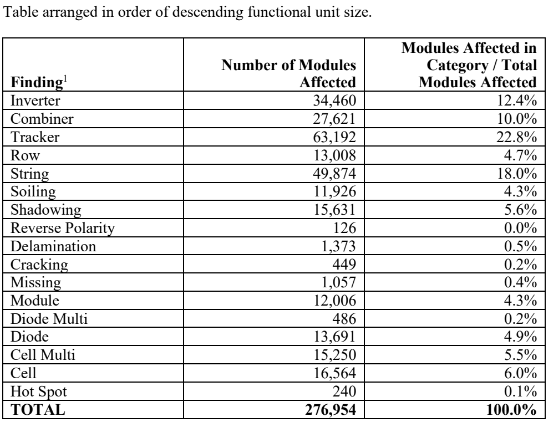
Production affected by each category was as follows:

Of the systems analyzed, 12%, 23% and 36% of the modules, respectively, comprised Trina Solar, Jinko Solar and First Solar modules, and the rest had modules from other companies.
The report also lays out the number of modules affected by each category. All findings are normalized using the number of affected modules, and findings categories such as tracker, inverter and combiner are not implied to be caused by the modules, notes Raptor Maps:
“As an industry, we have made tremendous progress in ushering in an era of standardized, scalable modeling and analytical techniques,” says Edward Obropta, Raptor Maps’ chief technology officer.“The fact that we can encode module-by-module analytics into a global, geospatial PV data structure and simplify it into a digestible summary is just the beginning of the bright future that lies ahead for PV.”
More on the report can be found here.


